Investing in Smart Contract Platforms

Zach Pandl
Last Updated: 1/29/2026 | 31 min. read
Key Takeaways
Crypto investing typically begins with Bitcoin, the first public blockchain and by far the largest by market capitalization. After more than 10 years of development on new blockchain use cases, Bitcoin still accounts for about two thirds of investable crypto market cap (Exhibit 1). Bitcoin is a digital currency and digital payments system that operates on a network of computers[1] around the world. Like other currencies, demand for Bitcoin derives from its properties as a store of value (scarce and transparent supply) and as a medium of exchange (censorship-resistant digital payments). Grayscale believes Bitcoin’s monetary properties may have rising demand due to modern macroeconomic imbalances.
Smart contract platforms are the cornerstone of crypto investing beyond Bitcoin. If Bitcoin showed that public blockchain technology can offer innovations in digital money, smart contract platforms demonstrate that blockchains can provide equally profound breakthroughs in digital finance.
Exhibit 1: Smart Contact Platforms Are Largest Crypto Segment After Bitcoin

Introduced with Ethereum in 2015 — but based on concepts from the late 1990s — smart contract blockchains extend Bitcoin’s vision from a network for transactions to a platform for financial applications. Virtually all the real-world applications of blockchain technology — including stablecoins, tokenized assets, and decentralized finance — are grounded in smart contracts and operate on smart contract blockchains. Usage of these applications in turn drives value back to smart contract platforms and their tokens.
Bitcoin can be thought of as “digital gold”: a scare commodity and monetary asset not issued by a nation state. Ethereum has been described as a decentralized App Store, an operating system for decentralized finance, HTTP for money and value, and as a “world computer.” But in truth smart contract platforms defy simple metaphors. These networks offer an entirely new paradigm for global finance based on decentralization and open-source software. They intend to disrupt the networks of intermediaries — like banks, brokers, custodians, and credit card companies — that constitute the existing financial system. There is no simple metaphor for smart contract blockchains because there is no parallel in traditional finance.
Today smart contract platform tokens like Ether (ETH) and Solana (SOL) account for about 70% of investable crypto market cap beyond Bitcoin.[2] Like Bitcoin, they can be incorporated into diversified portfolios to potentially provide return enhancement and diversification. Investors evaluating the crypto asset class could potentially consider allocating to both Bitcoin and smart contract platforms to capture the macro and technological drivers of returns.
Smart contracts are a concept from computer science that refers to pre-programmed and self-executing computer code.[3] Nick Szabo, the computer scientist who pioneered this idea in the mid-1990s, compared smart contacts to a vending machine. Like a vending machine, a user typically “inserts'' a digital token into a smart contract application and the software performs some type of pre-defined operation.[4] If a vending machine can be thought of as self-executing hardware, smart contacts are akin to self-executing software.
With the addition of smart contracts, the block-by-block updating of a blockchain can be used to record the operations of applications, in addition to peer-to-peer transactions. In other words, smart contract platform blockchains like Ethereum can do what Bitcoin does — record transactions between user wallets — but they can also do much more (Exhibit 2).[5]
Exhibit 2: Ethereum expands on Bitcoin’s vision

Stablecoins, tokenized assets, and decentralized finance are all examples of real-world applications of smart contract technology. Virtually any financial transaction can theoretically be executed by a decentralized application running on a smart contract blockchain, and the pace of innovation across the industry remains high. Today smart contract blockchains excel at specific types of financial transactions, including collateralized lending, trading of crypto-native assets, and cross-border payments.
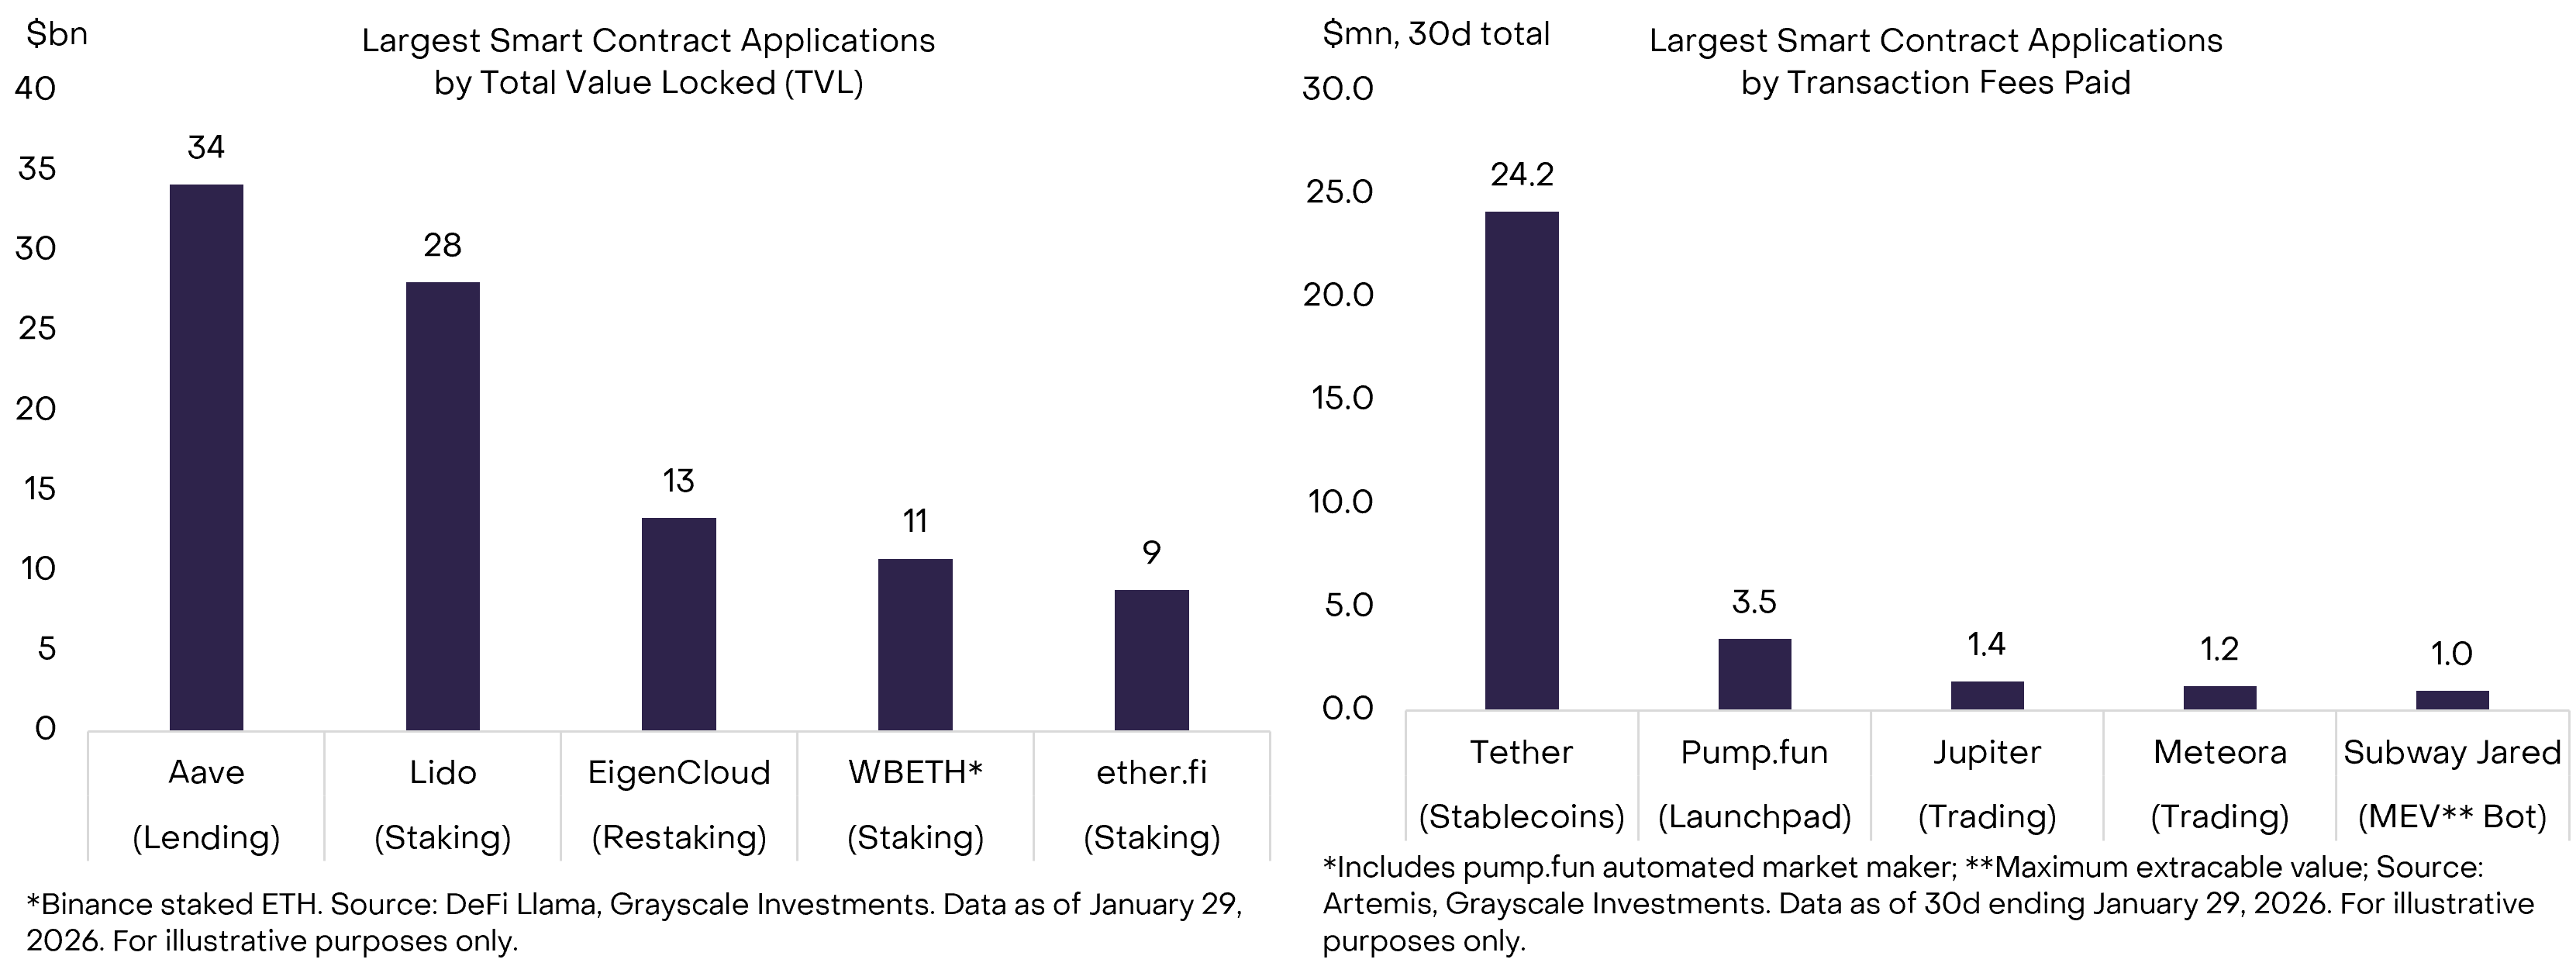
To measure usage of these applications, analysts typically use two primary indicators: (i) the amount of capital deployed, usually defined as Total Value Locked (TVL) and (ii) the amount of transaction activity related to use of the applications. The largest applications by TVL tend to be focused on collateralized lending and staking; the largest applications by transaction activity include stablecoins and decentralized exchanges (Exhibit 3-4).
Exhibit 3: More than $100 billion “locked” in smart contract applications

Exhibit 4: Leading applications relate to lending, staking, stablecoins, and trading
To systematically categorize digital assets and measure token price performance, Grayscale uses Crypto Sectors, a proprietary framework developed in partnership with index specialist FTSE/Russell. Today the Smart Contract Platforms Crypto Sector includes more than 40 networks with a combined token market capitalization of about $650 billion.[6]Today Ethereum is the largest network in the Smart Contract Platforms Crypto Sector by market cap, followed by BNB Chain (BNB) and Solana (Exhibit 5).
Exhibit 5: Ethereum current largest smart contract platform token by market cap

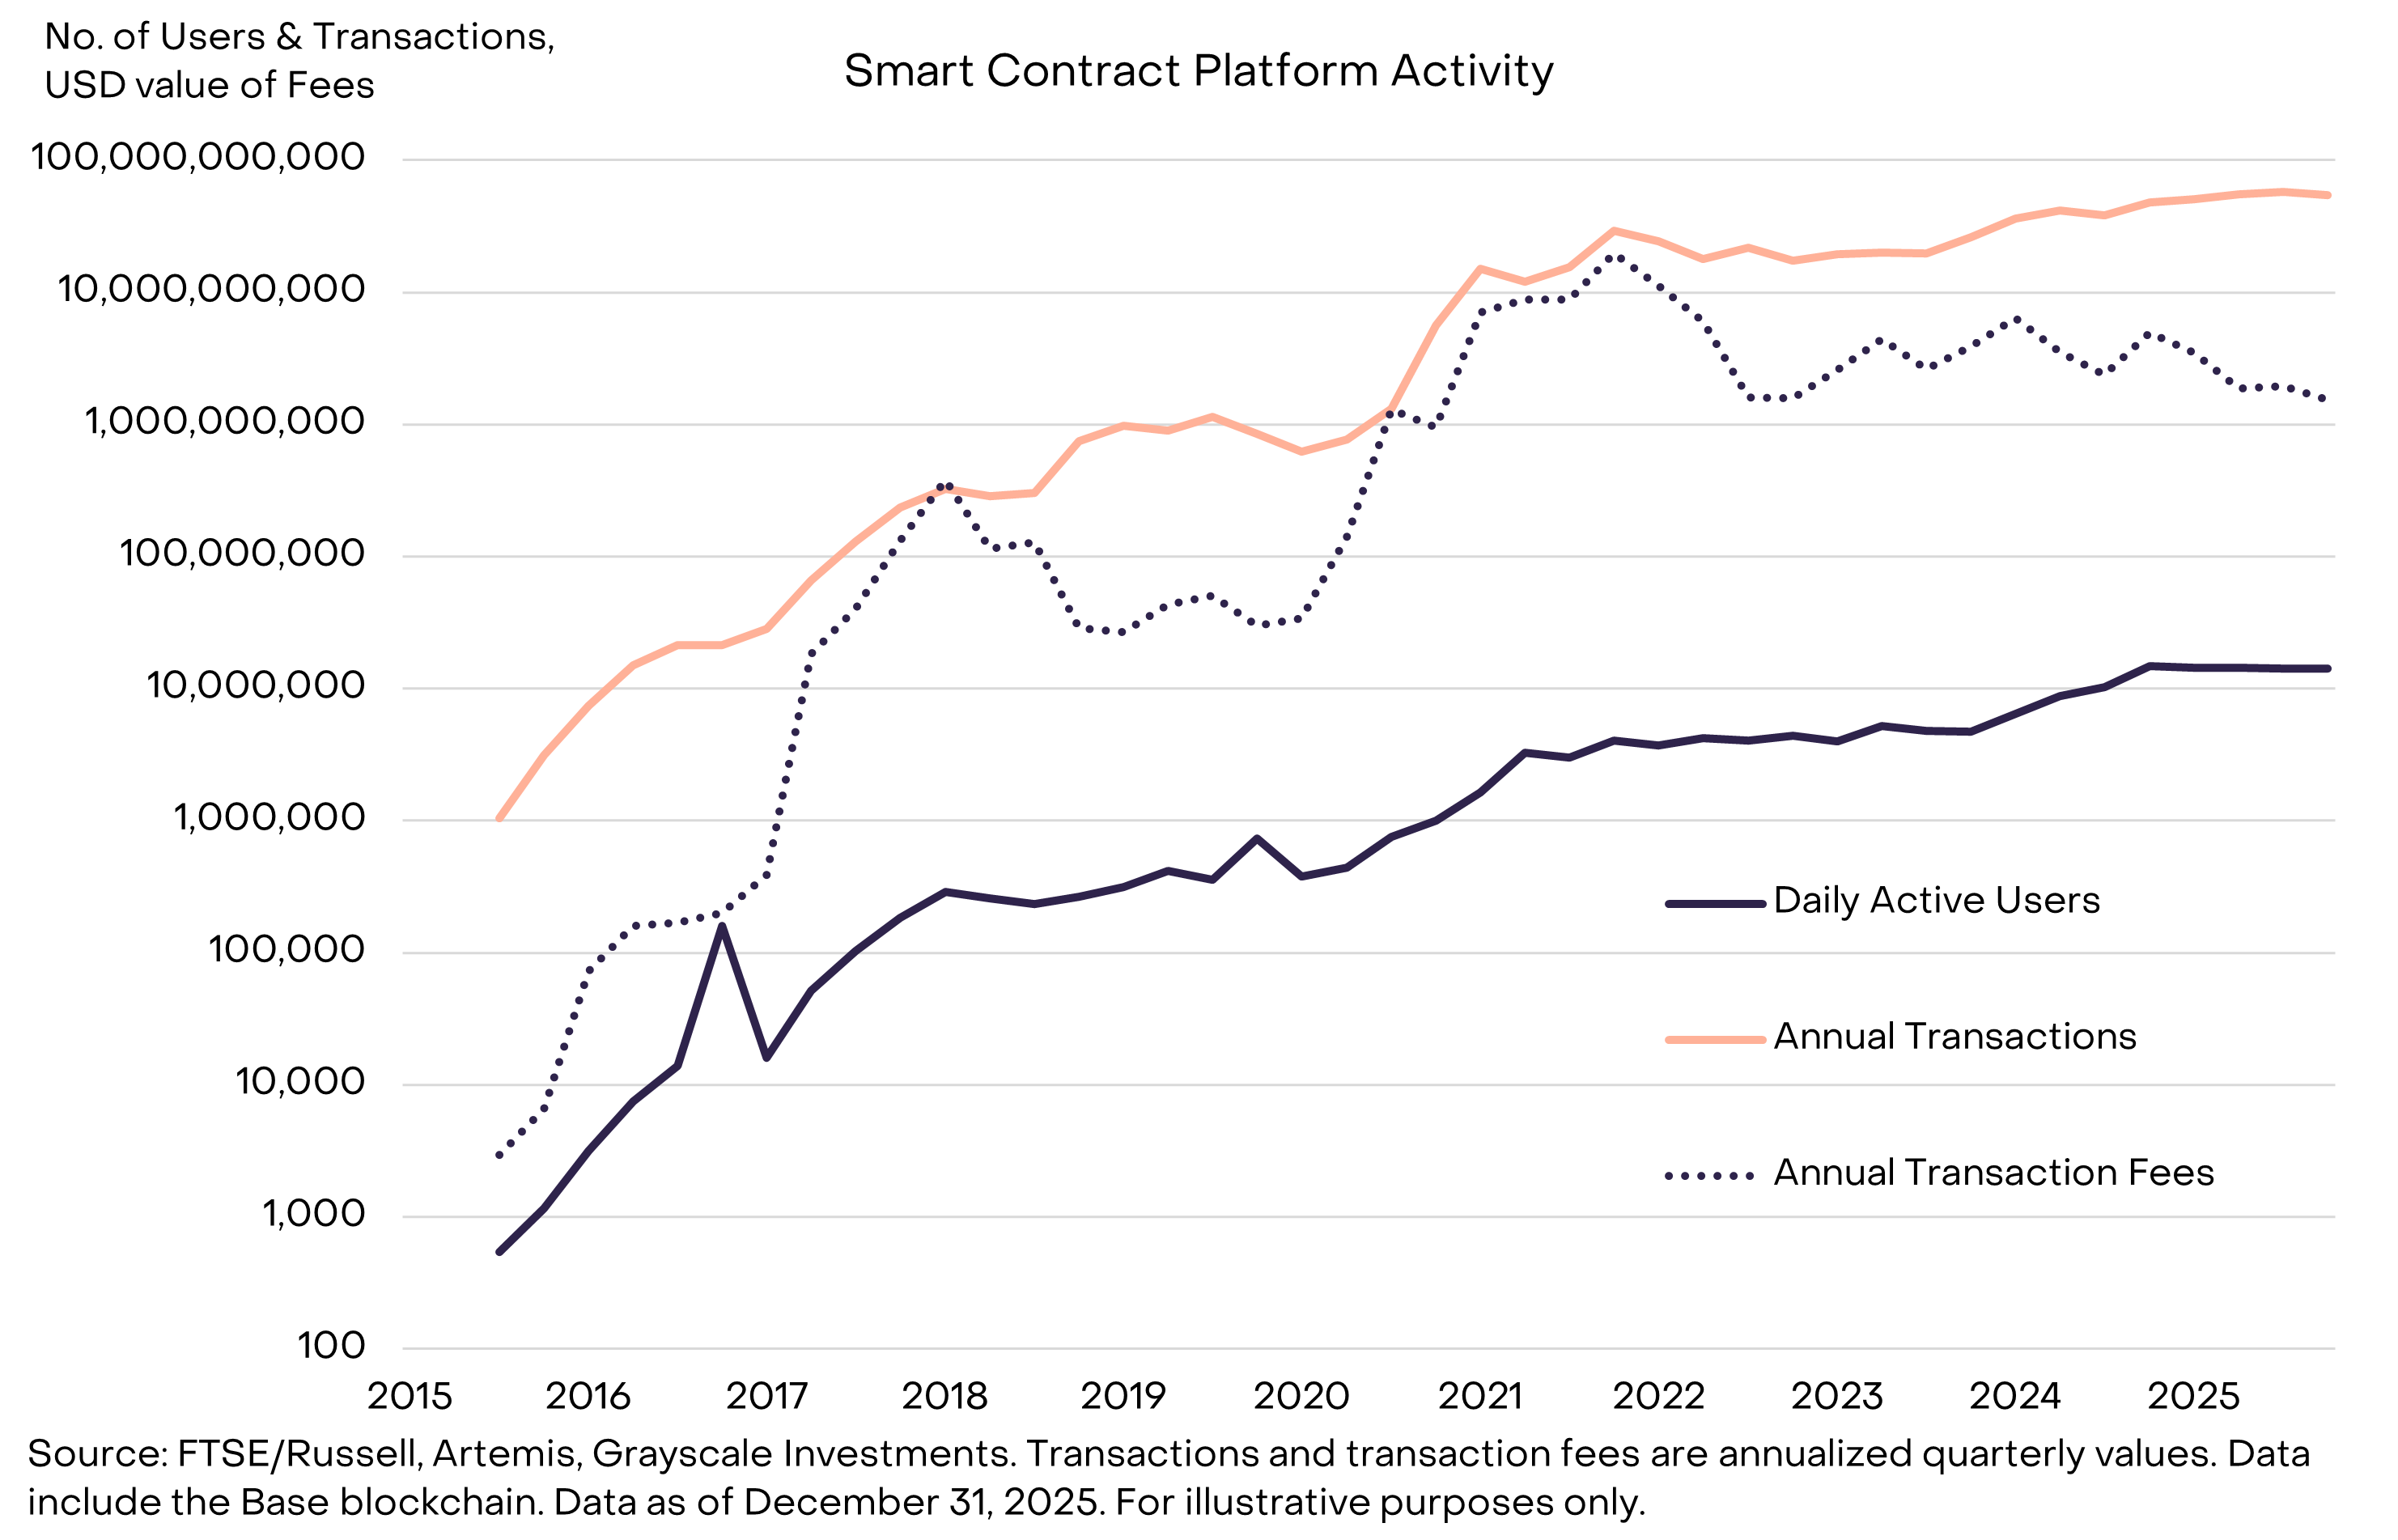
Users may adopt stablecoins and other smart contract-based applications because they provide advantages over traditional financial tools. These may include speed, cost, access, and/or other features (for background, see Stablecoins and the Future of Payments and Public Blockchains and the Tokenization Revolution). Across the Smart Contract Platforms Crypto Sector, aggregate economic activity has increased significantly over time (Exhibit 6). In 2016, the first full year after Ethereum was introduced, smart contract platforms had around 50,000 daily active users, processed about 15 million transactions, and earned about $150,000 in transaction fee revenue.[7] By 2025, smart contract platforms had nearly 15 million daily active users, processed more than 50 billion transactions.
Exhibit 6: Significant growth in activity over time
Smart contract platforms monetize network activity through transaction fees — known on Ethereum as “gas fees” — which are payments required to execute transactions or interact with smart contracts. In traditional finance, economic activity accrues value to intermediaries like banks; in blockchain-based finance it accrues value to smart contract platforms and related software. In 2025, we estimate that users of smart contract platforms paid a total of $2.2 billion in transaction fees.[8]
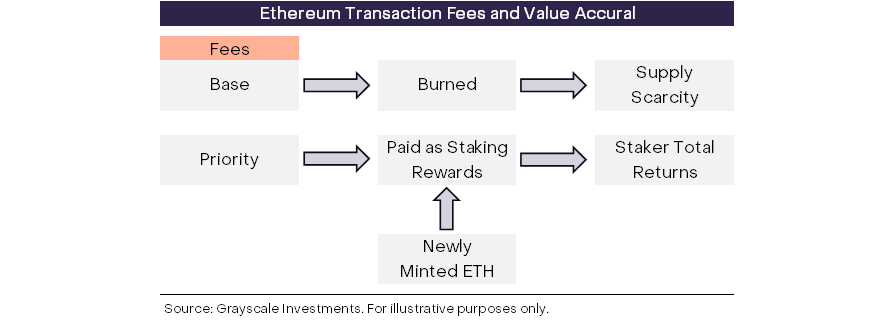
There is no common transaction fee model across all networks, but in general fees accrue value to token holders through mechanics that resemble dividends and buybacks in equity markets. On Ethereum, for example, priority fees are paid to validators as a part of staking rewards, similar to dividends, while base fees are burned to reduce ETH supply, rewarding all token holders, similar to buybacks (Exhibit 7; for more detail, see Ethereum: The OG Smart Contract Blockchain).[9] On Solana, half of base transactions fees are burned, while the other half plus all priority fees are earned by validators (for more detail, see Solana: Crypto’s Financial Bazaar).
Exhibit 7: Tokens accrue value from network fees
Smart contract platform tokens — e.g., ETH, BNB, SOL, SUI, AVAX — represent an ownership stake in their respective networks. Generally speaking, the investment thesis for smart contract platform tokens centers on the potential growth in the size of these networks: more users, more transactions, and more fees will likely translate into higher market values over time, in our view. In addition, a small subset of smart contract platform tokens may also be in demand as monetary assets or alternative stores of value (similar to how certain precious metals have both industrial and investment use).
Like Bitcoin, smart contract platform tokens have delivered strong investment returns along with portfolio diversification benefits. Relative to Bitcoin, smart contracts tokens as a category have had higher returns, higher volatility, and a slightly higher correlation to stocks.[10] There has also been meaningful return dispersion across tokens, and therefore opportunities for outperformance or underperformance depending on token selection (see the section below on Network Competition).
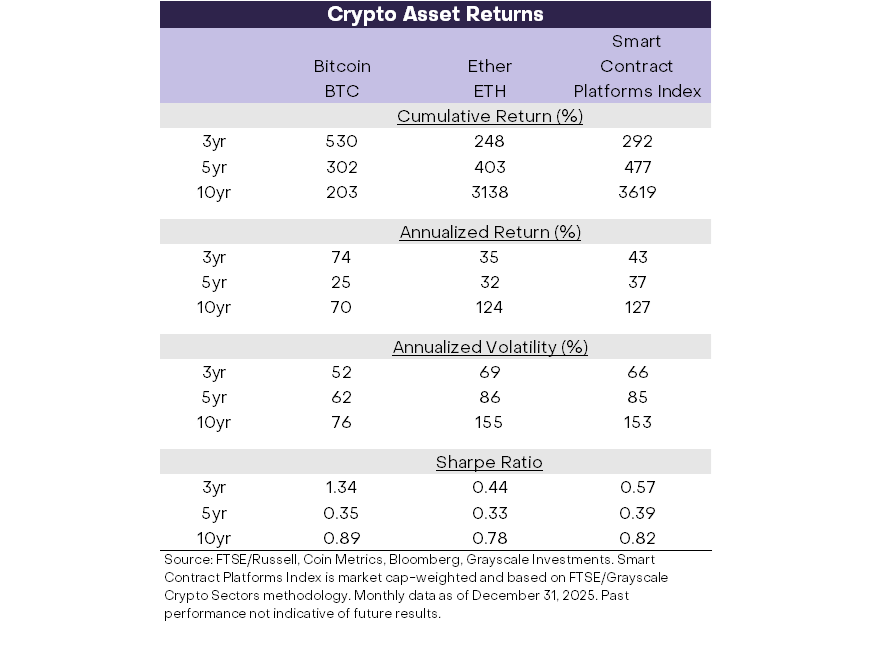
Exhibit 8 provides historical investment returns for Bitcoin (BTC), Ether (ETH), and a market cap-weighted index of smart contract platform tokens. Over the last 3-5 years, an investor in Ether or a basket of smart contract platform tokens would have earned 30%-40% annualized returns on volatility of 65%-90% (indexes are unmanaged as it is not possible to invest directly in an index). Past performance is not indicative of future results.
Exhibit 8: Smart contract platform returns averaged 30%-40% annualized last 3-5yrs
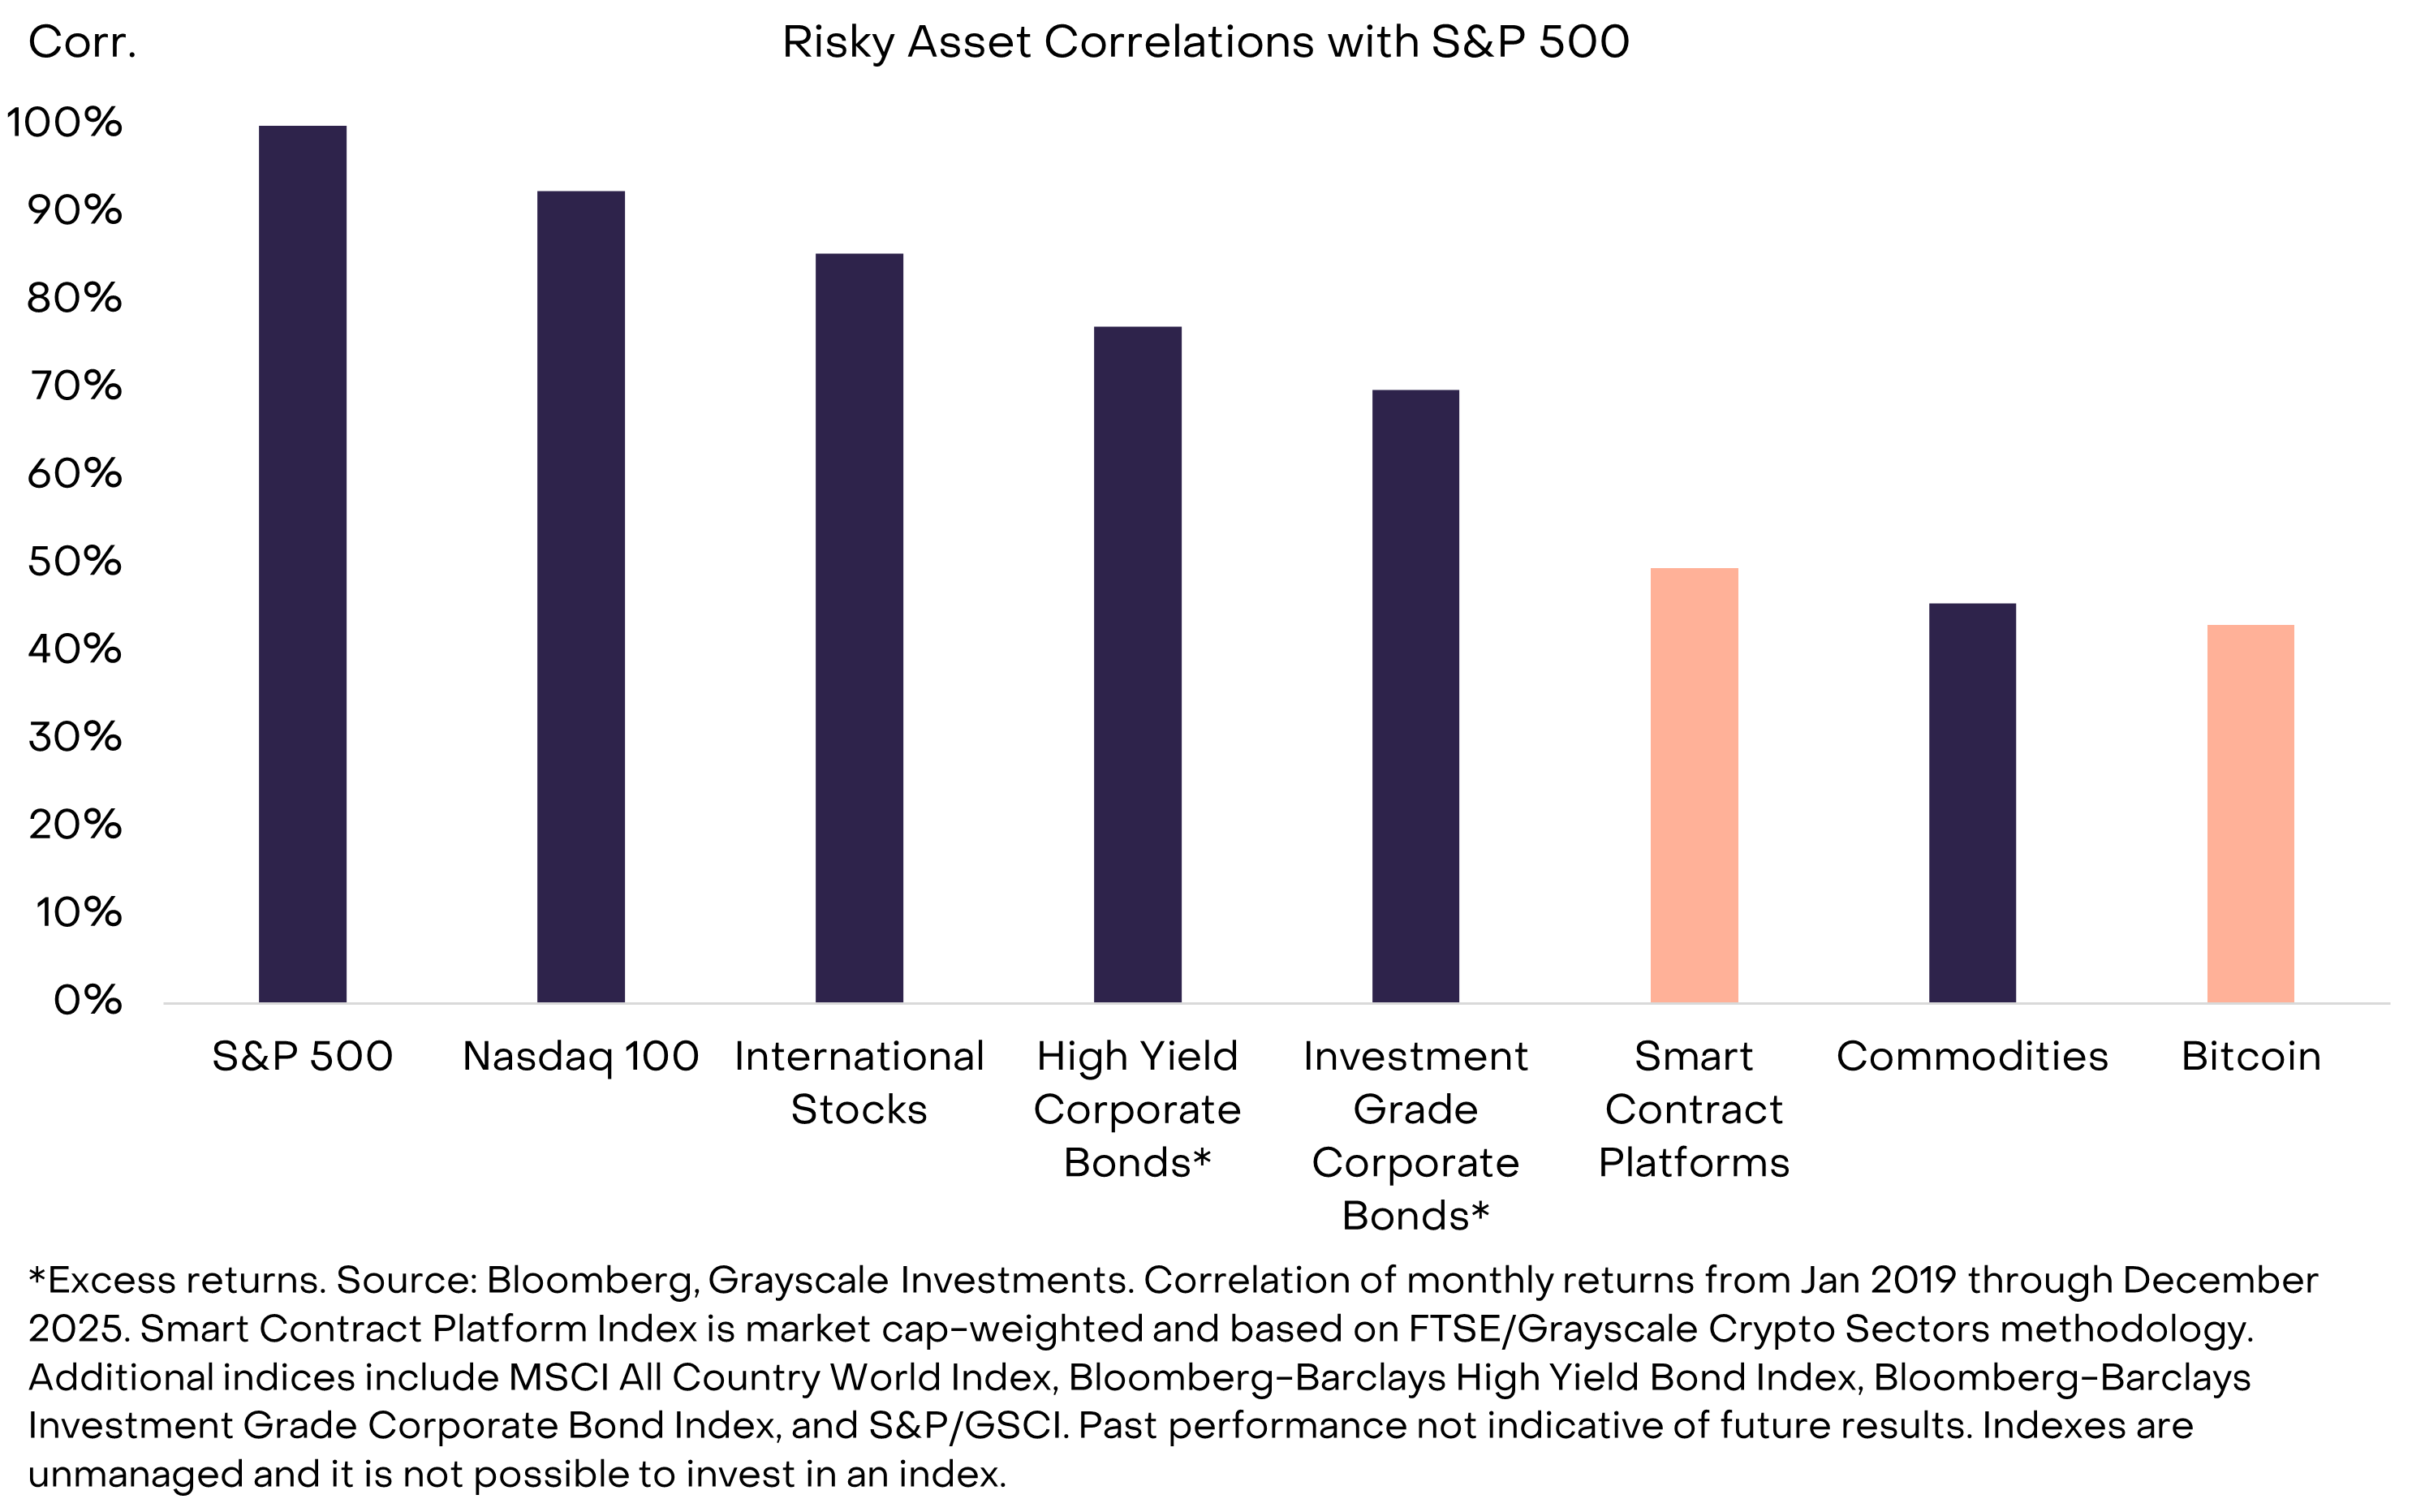
Returns for smart contract platform tokens have been moderately correlated to public equities, such that they may provide diversification benefits in a portfolio. Since 2019, for example, monthly smart contract platform returns have had a correlation of 50% with the S&P 500 — only slightly higher than Bitcoin or an index of physical commodities (Exhibit 9).
Exhibit 9: Smart contract platforms have slightly higher correlation with equities
In prior work, we demonstrated that adding Bitcoin to a conventional 60/40 portfolio may enhance both absolute and risk-adjusted returns, assuming Bitcoin’s return properties are comparable to the past. The same result potentially applies to Ethereum and other smart contract platform tokens. In the analysis below, we simulate the impact of adding Ether and a market cap-weighted index of smart contract tokens to a variety of portfolios.[11] The quantitative results are based on ex-post returns; they are strictly hypothetical and do not reflect actual results achieved by an investor (see below for additional disclosures about hypothetical/simulated performance).
Reflecting high past returns, adding smart contracts to a diversified portfolio would have hypothetically lifted total portfolio returns (Exhibit 10). For example, adding a 5% allocation to smart contract platforms in a 60/40 portfolio raises five-year annualized returns from 7.3% (leftmost column of Exhibit 10) to 10.1% (rightmost column of Exhibit 10). Crypto assets are relatively volatile assets, so allocating to either Bitcoin or smart contract platforms will also typically raise total portfolio volatility and increase maximum drawdowns. However, because of their moderate return correlations to traditional assets, incorporating them into portfolios may also increase risk-adjusted returns, as shown by the incrementally increasing Sharpe Ratios in the bottom row of the table.
Exhibit 10: Adding smart contracts to portfolio may improve risk-adjusted returns
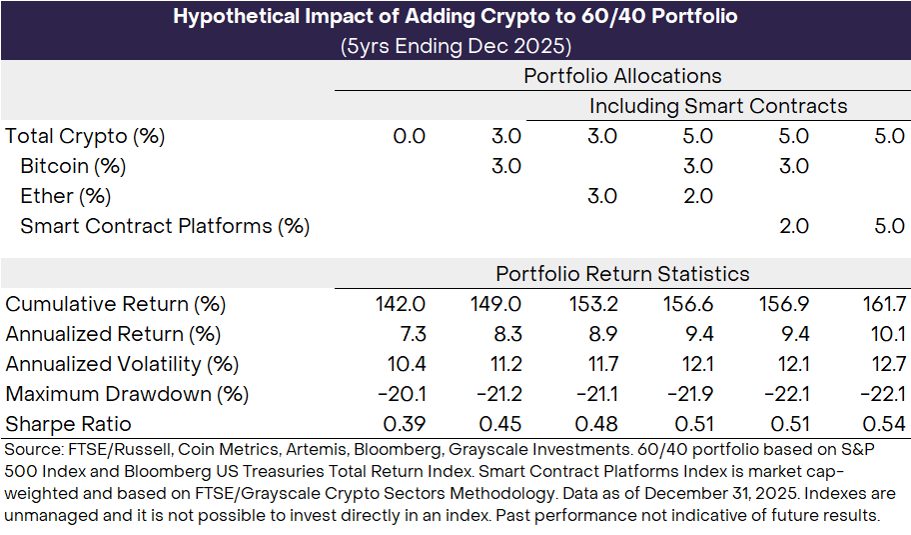
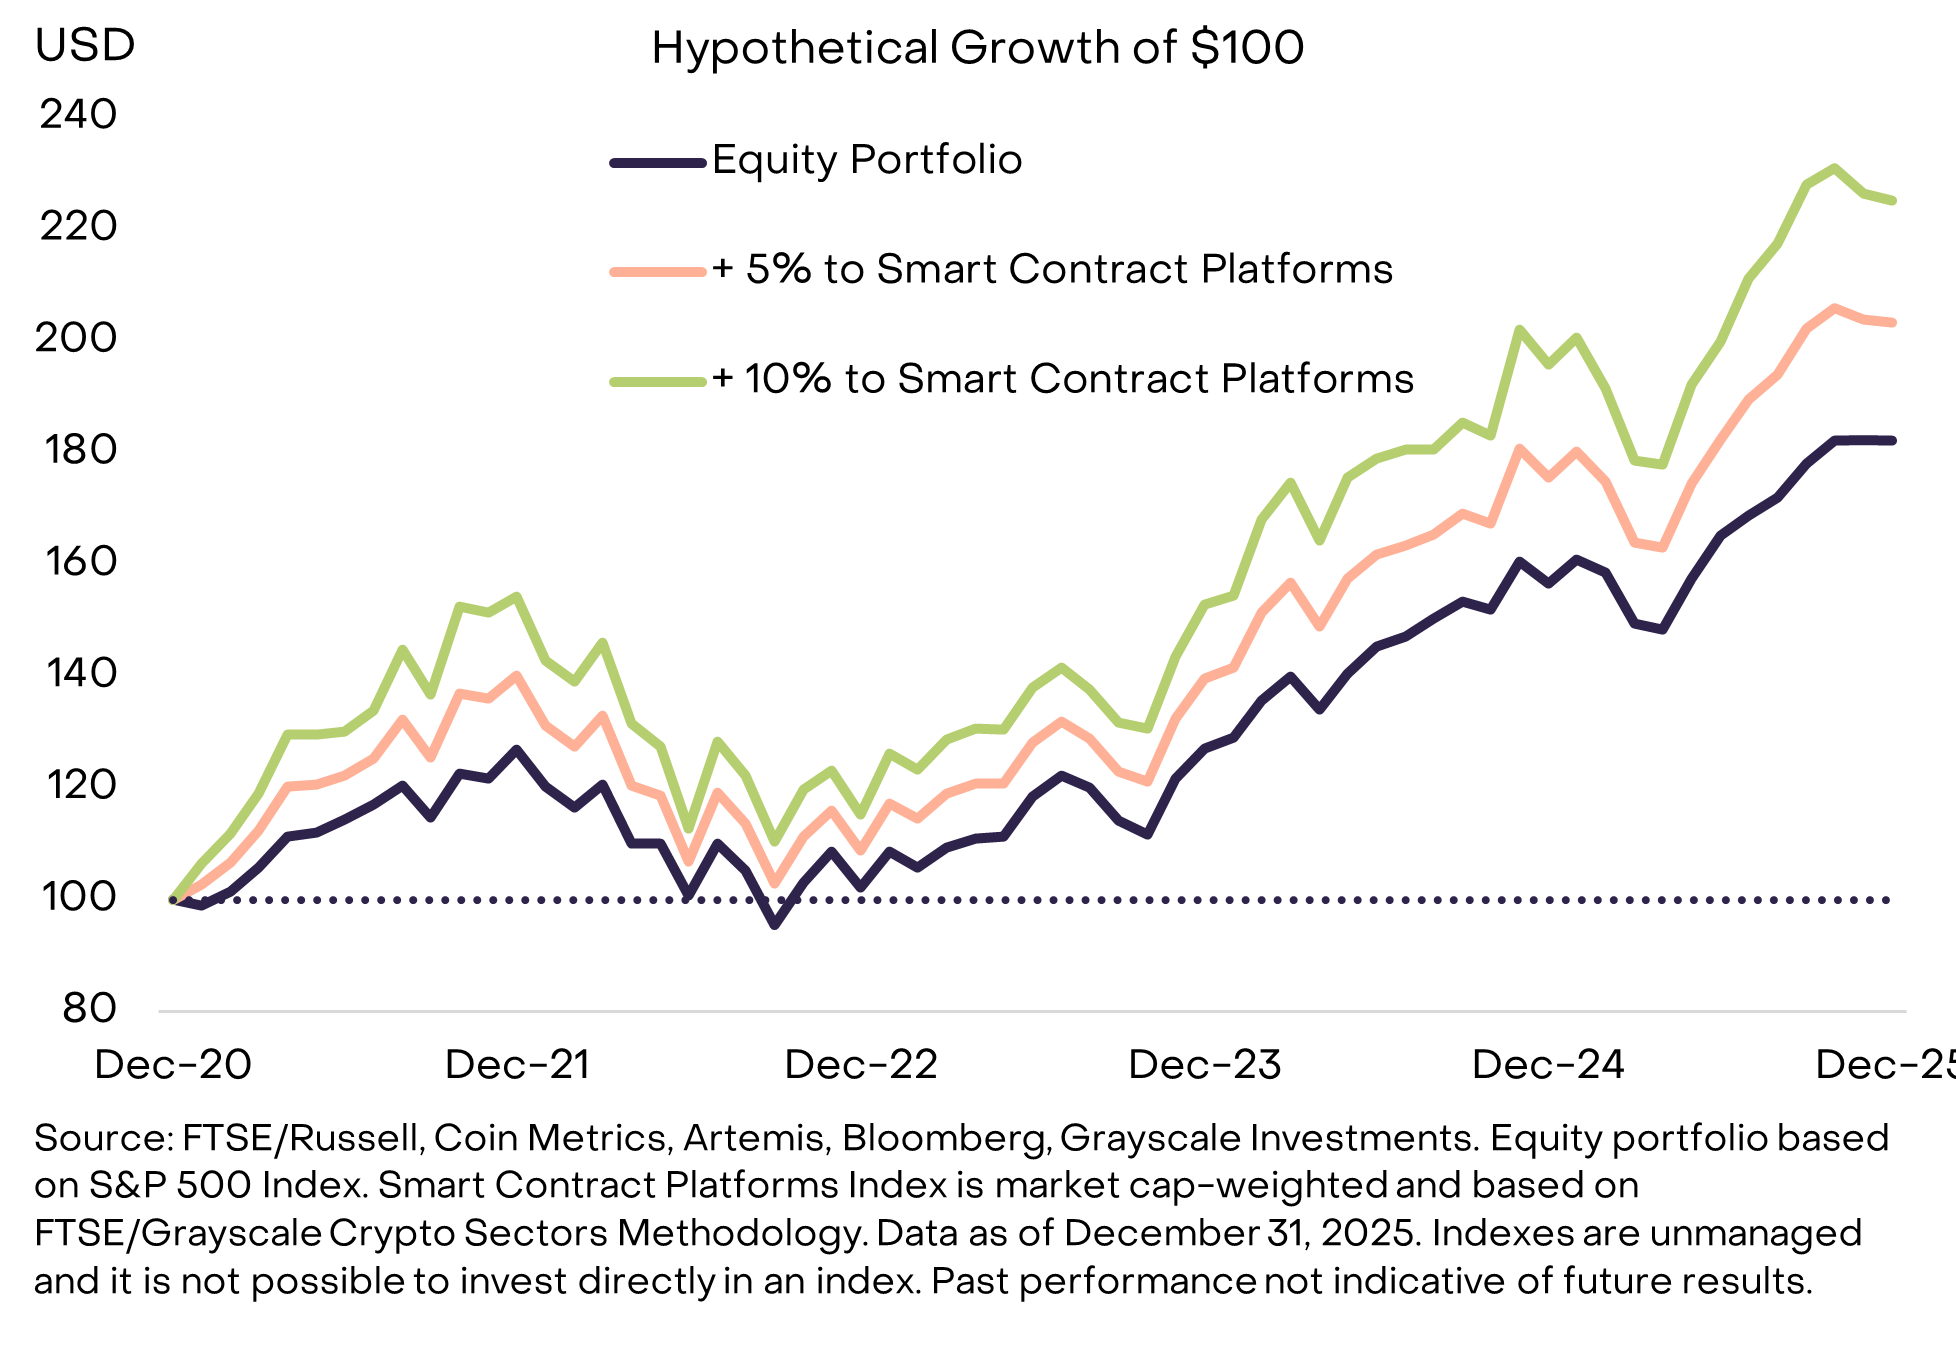
Exhibit 11 shows the impact on cumulative returns from two examples: a 60/40 portfolio allocating 2% and 5%, respectively, to a market cap-weighted index of smart contract platform tokens. In these examples, cumulative returns over the last five years rise from 142% for the standard 60/40 portfolio to 150% with a 2% allocation to smart contracts, and 162% with a 5% allocation to smart contracts.
Exhibit 11: Historically higher returns (and higher risk) with smart contract platforms

Alternatively, we can consider the impact of adding smart contract platform tokens to an equity-only portfolio. Crypto assets can be considered an alternative way to position portfolios for growth. And because of crypto asset volatility, they may be a better substitute in portfolios for stocks than bonds. Similar to the results for 60/40 portfolios, based on ex-post returns, a hypothetical allocation to smart contact platforms in an equity-only portfolio would tend to raise both absolute and risk-adjusted returns (Exhibit 12).
Exhibit 12: Smart contract platforms another way to position for growth
In addition to the potential for token price increases, most smart contract platforms also offer staking rewards to token holders that help secure the blockchain (for background, see Staking 101: Secure the Blockchain, Earn Rewards). Staking rewards mean that smart contract platform tokens are both commodities with functional utility and potentially income-producing assets. Staking rewards are meaningful relative to yields on traditional assets but typically modest compared to token price volatility — and price volatility should be considered the primary driver of investment risk and return.
Currently Ethereum offers a nominal staking reward rate of about 3%, and Solana offers a nominal staking reward rate of about 7% (Exhibit 13). These rewards contribute to total returns: since the introduction of staking in 2022, the price of ETH has increased 93% while the total return from holding staked ETH was 119%.[12]
Exhibit 13: Staking rewards may enhance total returns

Smart contract platforms are a highly competitive industry. The developers of these software technologies make design choices to attract application developers and end users. Successful smart contact platforms give users a reason to remain on the network — rather than switch to other networks — and thereby capture a degree of pricing power.
In 2025, four smart contract platforms accounted for more than 90% of transaction fees: Ethereum, BNB Chain, Solana, and Tron (Exhibit 14). Investors may want to consider how the nature of fee competition will evolve over time in light of technological progress in the crypto industry, changes in the regulatory landscape, and other factors.
Exhibit 14: Four networks currently lead transaction fee capture

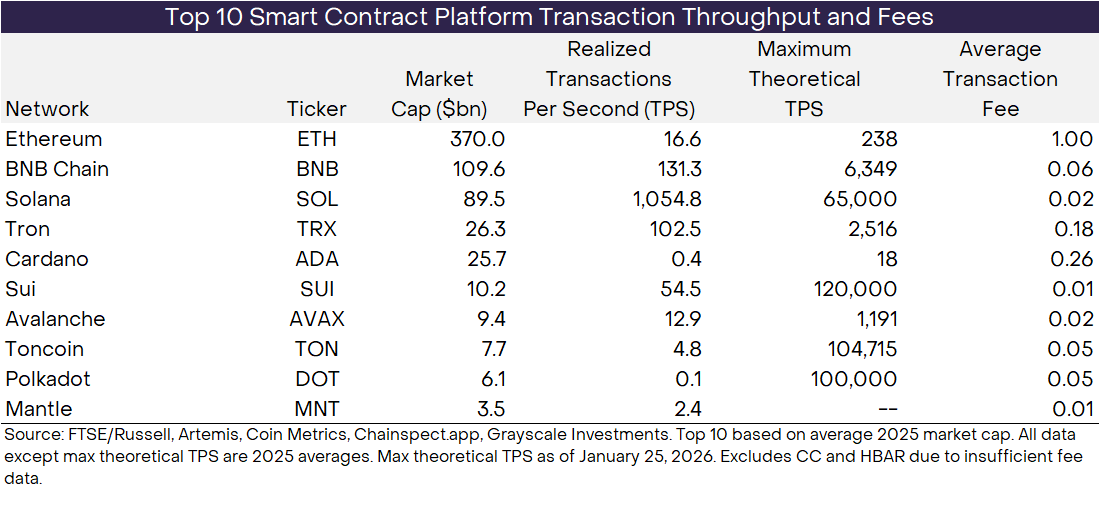
The unique design choices of each blockchain result in different outcomes for transaction capacity and transaction costs (Exhibit 15). Ethereum, for example, has relatively low transaction volumes but earns a relatively high weighted-average transaction fee (~$1.00 in 2025). In contrast, Solana achieves high transaction volumes with a relatively low weighted-average transaction fee (~$0.02 in 2025). Blockchains are not businesses, and they are not necessarily designed to generate fee revenue. However, they are, in effect, competing to find the combination of transaction throughput and average transaction cost that maximizes total network transaction fees.
Exhibit 15: Alternative design choices for smart contract platforms
Not every smart contact blockchain will succeed in the longer run. Like other industries dominated by network effects, Grayscale Research expects a small number of smart contract platforms to dominate the industry in terms of fundamentals (users, transactions, fees, etc.) and token valuation. Given current competitive positioning and considering other factors relevant to the market outlook, Grayscale Research currently believes these five networks have the best chance of capturing industry growth over time:
Ethereum (ETH): The OG smart contract platform differentiates with an emphasis on decentralization, security, and neutrality and continues to lead the industry in terms of the size of application ecosystem, the number of developers, and the value of on-chain capital.
Solana (SOL): Crypto’s “financial bazaar” offers fast and cheap transactions and stands out for the depth and diversity of its on-chain activity. Today it’s the category leader in terms of users, transaction volume, and transaction fees — arguably the three most important measures of blockchain activity.
Sui (SUI): This next-generation blockchain is engineered for scale and designed to support mass-market applications, and is supported by a world-class team with a compelling development strategy.
BNB Chain (BNB): Binance is the largest exchange in crypto by a significant margin, boasting an estimated 300 million users and about 44% of spot Bitcoin trading volume.[13] Its home-grown blockchain is uniquely positioned to onboard users.
Avalanche (AVAX): Blockchains will need to be customized to satisfy the needs of millions of more users. Avalanche leans into this mass customization model and is an industry leader in gaming and certain other categories.
There are many more smart contract platforms that differentiate along certain dimensions, including design philosophy (e.g., Cardano), category focus (e.g., Tron), institutional partnerships (e.g., Canton and Hedera), and access to potential users (e.g., The Open Network, Mantle, and Base). Investors should continually reevaluate the competitive positioning and risks associated with each network before allocating capital.
As noted above, allocating to smart contract platform tokens has tended to increase portfolio risk — both in terms of annualized volatility and maximum drawdown. Beyond these standard measures of investment risk, the most important factor for investors to consider, in our view, relates to uncertainty around value accrual. Although Ethereum is now more than 10 years old, there is still debate among crypto investors over the relationship between network activity, transaction fees, and token valuation.[14]
Over time, growth in smart contract platform transaction fees has lagged growth in the number of users and the volume of transactions. In other words, the average cost to transact on these networks has declined. Historically, smart contract fees varied within a range of roughly $0.25 to $1.00 per transaction (Exhibit 16). However, the proliferation of fast and cheap blockchains like Solana and its competitors — as well as efforts by Ethereum to scale through Layer 2 networks and larger blocks — has compressed average fees to more consistently low levels across the industry. In 2025, the weighted average transaction costs across all smart contract platforms averaged just $0.04.
Exhibit 16: Compression of transaction fees over time

Grayscale Research believes that downward pressure on transaction costs will slow and total transaction fees will rise over time alongside growth in users and transaction volumes. Smart contract platforms fees are already relatively low, for example, compared to credit card network fees.[15] However, a key downside risk to investing in smart contract platforms — especially the fast and cheap blockchains with a high degree of centralization — is that price competition will remain intense, resulting in continued downward pressure on transaction costs. In that scenario, these networks maystruggle to generate more fee revenue even as transaction volume continues to grow.
It is important to stress that transaction fees are not the only fundamental variable that matters, and certain crypto assets, including Bitcoin, have a high market capitalization despite only moderate fees. In our view, Bitcoin and a small number of crypto assets may be in demand as scarce digital commodities and alternative stores of value, beyond the network’s value in processing transactions (similar to how certain precious metals have both industrial and investment use). Within the Smart Contract Platforms Crypto Sector, Ethereum specifically may command a so-called “money premium” because of a high degree of decentralization and token supply scarcity.
Regulatory clarity in the United States and other countries is opening access to smart contact-based applications to many more users and creating new investment opportunities in smart contract platform tokens. Ethereum and its peers offer an alternative vision for global finance based on decentralization and open-source software. If usage of these platforms grows over time, Grayscale Research believes it will drive value to the networks’ native tokens — including ETH, SOL, SUI, BNB, and AVAX. Incorporating these assets into diversified portfolios may enhance risk-adjusted returns.
Note On Hypothetical Simulated Performance Results
HYPOTHETICAL SIMULATED PERFORMANCE RESULTS HAVE CERTAIN INHERENT LIMITATIONS. There is no guarantee that the market conditions during the past period will be present in the future. Rather, it is most likely that the future market conditions will differ significantly from those of this past period, which could have a materially adverse impact on future returns. Unlike an actual performance record, simulated results do not represent actual trading or the costs of managing the portfolio. Also, since the trades have not actually been executed, the results may have under or over-compensated for the impact, if any, of certain market factors, such as lack of liquidity. Simulated trading programs in general are also subject to the fact that they are designed with the benefit of hindsight. NO REPRESENTATION IS BEING MADE THAT ANY ACCOUNT WILL OR IS LIKELY TO ACHIEVE PROFITS OR LOSSES SIMILAR TO THOSE SHOWN. PAST PERFORMANCE IS NOT INDICATIVE OF FUTURE RESULTS.
The hypothetical simulated performance results are based on a model that used inputs that are based on assumptions about a variety of conditions and events and provides hypothetical, not actual results. As with all mathematical models, results may vary significantly depending upon the value of the inputs given, so that a relatively minor modification of any assumption may have a significant impact on the result. Among other things, the hypothetical simulated performance calculations do not take into account all aspects of the applicable asset’s characteristics under certain conditions, including characteristics that can have a significant impact on the results.
Further, in evaluating the hypothetical simulated performance results herein, each prospective investor should understand that not all of the hypothetical assumptions used in the model are described herein, and conditions and events that are not accounted for by the model may have a significant adverse effect on the performance of the assets described herein.
Prospective investors should consider whether the behavior of these assets should be tested based on different and/or additional assumptions from those included in the information herein.
IN ADDITION TO OTHER DIFFERENCES, PROSPECTIVE INVESTORS IN A PRODUCT SHOULD NOTE THE FOLLOWING POTENTIALLY SIGNIFICANT DIFFERENCES BETWEEN THE ASSUMPTIONS MADE IN THE HYPOTHETICAL SIMULATED PERFORMANCE RESULTS INCLUDED HEREIN AND THE CONDITIONS UNDER WHICH A PRODUCT WILL PERFORM, WHICH COULD CAUSE THE ACTUAL RETURN OF SUCH PRODUCT TO DIFFER CONSIDERABLY FROM RETURNS SET FORTH BY THE HYPOTHETICAL SIMULATED PERFORMANCE, TO BE MATERIALLY LOWER THAN THE RETURNS AND TO RESULT IN LOSSES OF SOME OR ALL OF THE INVESTMENT BY PROSPECTIVE INVESTORS:
IN ADDITION, THE HYPOTHETICAL SIMULATED PERFORMANCE RESULTS DO NOT ASSUME ANY GAINS OR LOSSES FROM TRADING AND THEREFORE DO NOT REFLECT THE POTENTIAL LOSSES, COSTS AND RISKS POSED BY TRADING AND HOLDING ACTUAL ASSETS. The hypothetical simulated performance results do not reflect the impact the market conditions may have had upon a portfolio were it in existence during the historical period selected. The hypothetical simulated performance results do not reflect any fees incurred by a portfolio. If such amounts had been included in the hypothetical simulated performance, the results would have been lowered.
AS A RESULT OF THESE AND OTHER DIFFERENCES, THE ACTUAL RETURNS OF A PORTFOLIO MAY BE HIGHER OR LOWER THAN THE RETURNS SET FORTH IN THE HYPOTHETICAL SIMULATED PERFORMANCE RESULTS, WHICH ARE HYPOTHETICAL AND MAY NEVER BE ACHIEVED. Reasons for a deviation may also include, but are by no means limited to, changes in regulatory and/or tax law, and generally unfavorable market conditions.
Index definitions:
The Bloomberg US Corporate High Yield Bond Index measures the USD-denominated, high yield, fixed-rate corporate bond market. The S&P GSCI is a benchmark for investment in the commodity markets and is a measure of the performance of the global commodity market. The Nasdaq 100 Index is a stock index of the 100 largest companies by modified market capitalization trading on Nasdaq exchanges. The S&P 500 Index is a market-capitalization-weighted index that measures the performance of 500 of the largest publicly traded companies in the United States. The MSCI ACWI captures large and mid cap representation across 23 Developed Markets and 24 Emerging Markets countries. The Bloomberg U.S. Treasury Total Return Index measures the total return performance of the U.S. Treasury bond market by tracking U.S. Treasury securities and assuming reinvestment of all coupon payments. The Bloomberg U.S. Corporate Investment Grade Bond Index measures the performance of the U.S. dollar–denominated, investment-grade corporate bond market. The FTSE Russell Smart Contract Platforms Index is a rules-based crypto sector index designed to measure the performance of digital assets that power programmable blockchain networks capable of executing smart contracts.
[2] Source: FTSE/Russell, Artemis, Grayscale Investments. Data as of December 21, 2025.
[3] Smart contracts originally related to the idea that aspects of legal contracts could be executed and enforced with computer code rather than legal intuitions, but today the term can apply to any pre-programmed application.
[4] This metaphor comes from computer scientist Nick Szabo’s 1997 memo “The Idea of Smart Contracts”.
[5] This is an oversimplification. The Bitcoin blockchain can also record some non-transaction data, and there is ongoing development work on Bitcoin Layer 2s, which will provide smart contract functionality.
[6] Source: FTSE/Russell, Grayscale Investments. Data as of January 28, 2026. The Smart Contract Platforms Crypto Sector excludes smart contract blockchains without a native token (e.g. Base) and blockchains with a narrow or single-application focus (e.g. Hyperliquid). Hyperliquid is a constituent of the Financials Crypto Sector.
[7] Only Ethereum and Ethereum Classic were operating in 2016. Daily active users typically approximated by daily active addresses. Source: FTSE/Russell, Artemis, Grayscale Investments. Data as of December 31, 2025.
[8] Source: Calculated by Grayscale Research based on data from FTSE/Russell, Artemis, and Coin Metrics. Includes all networks in Smart Contract Platforms Crypto Sector plus Base blockchain.
[9] For an academic discussion, see “A Macro Finance Model for Proof-of-Stake Ethereum”, Urban Jermann, working paper, June 2025.
[10] As measured by the S&P 500; see Exhibit 9 for details.
[11] Market cap-weighted index of smart contract platform tokens calculated by FTSE/Russell using Crypto Sectors methodology.
[12] Source: CoinDesk, Grayscale Investments. Data as of January 26, 2026.
[13] Source: Binance, Coin Metrics, Grayscale Investments. Spot trading volume as of 2025 and based on top 10 exchanges by volume.
[14] For an early analysis of this topic see “An (Institutional) Investor’s Take on Cryptoassets”, John Pfeffer, December 2017.
[15] For example, for a typical $100 credit card payment, about $0.80 is paid in network fees, of which ~$0.15 is earned by credit card companies and the remainder by banks and other network participants. See our report on stablecoins for more details.