Bigger is Better: Blockchains as Network Technologies

Zach Pandl
Last Updated: 10/11/2023 | 13 min. read
Networks
There are thousands of blockchain protocols, and many different ways in which individual tokens accrue value. But most projects in crypto have one thing in common: they are network technologies. Networks are a special type of good with the unique property that their value for any one user depends on the number of other users. These “network effects” are very common in information technology industries, and partly explain why Grayscale Research remains optimistic about the return potential of the crypto asset class in the years to come.[1]
A classic example of network technology is the telephone. One telephone on its own has no economic value—it only becomes valuable when there are other phones to connect to on the same network. This is very different from other types of goods and services, where the value to a consumer does not depend on the behavior of other consumers (think a slice of pizza or a haircut). There are many other types of network goods, including social media platforms, operating systems, or email. Both language and money can also be considered network technologies: they are only useful to the extent that other people are using them too.[2]
Because networks depend on the connections between users, they often feature a nonlinear relationship between adoption and value. There is a simple mathematical reason for this: the number of possible connections between users rises much faster than the number of users. For example, a network with two users has one possible connection; a network with four users has six possible connections; a network with eight users has 28 possible connections; and so on. Therefore, if a network’s utility is also a function of the number of possible connections, there should also be a nonlinear relationship between the number of users and network value.
Through this mechanism, the addition of each additional network participant initially has a large effect on network value. However, eventually the law of diminishing marginal returns takes over, and each new participant has a smaller and smaller effect on network value. Therefore, in network industries we should expect to see an “S-Curve” pattern, where network value initially rises exponentially as network size passes through a critical mass, then later levels off with diminishing marginal returns (Exhibit 1).
Exhibit 1: Network effects predict an “S-Curve” relationship between size and value
Researchers regularly document this pattern for network industries, and debate its precise mathematical form. In perhaps the most famous example, Robert Metcalfe, a developer of Ethernet technology, argued that Facebook’s revenue increased with the square of the number of Facebook users—a pattern referred to as “Metcalfe’s Law”.[3] The nonlinear relationship between social media revenues and the number of users—i.e., network size—has been documented for many other platforms, including LinkedIn, Twitter, and Reddit.[4]
Network Effects and Blockchains
Public blockchain data may reveal network effects for a variety of reasons. For example, to the extent that tokens are used as a money-like asset (i.e. a store of value or medium of exchange), holders will need to determine whether other users will accept the token for value in the future. Smart contract blockchains should also experience network effects through the availability of applications. The more applications that are available, the more useful the platform will be to consumers, and the more likely other developers will be to launch applications on the same platform. Similarly, platforms with large numbers of users will tend to offer higher liquidity for trading and possibly a deeper base of capital for new fundraising. In the blockchain ecosystem it seems, like in other network industries, bigger is better.[5]
Despite the crypto industry’s short history, we can already observe these patterns in the data. Exhibit 2 shows the relationship between daily active users and market capitalization (both expressed in logarithmic scale), for a collection of Layer 1s and Layer 2s.[6] As expected, the fitted line has a positive slope: chains with a larger number of users trade at a higher market capitalization. The relationship is also nonlinear: the slope of the fitted line is steeper for chains with a larger number of users. With some straightforward calculations, we can show that market capitalization rises more than one-for-one with the number of users once the number of network participants reaches roughly 650k—a group that includes BTC, ETH, MATIC, BNB, and TRX.[7] Conceptually, this could be considered an estimate of the “critical mass” required for a blockchain to begin experiencing nonlinear network effects (although we would stress that these estimates vary over sample periods).
Exhibit 2: Blockchains with more users trade at higher market capitalization
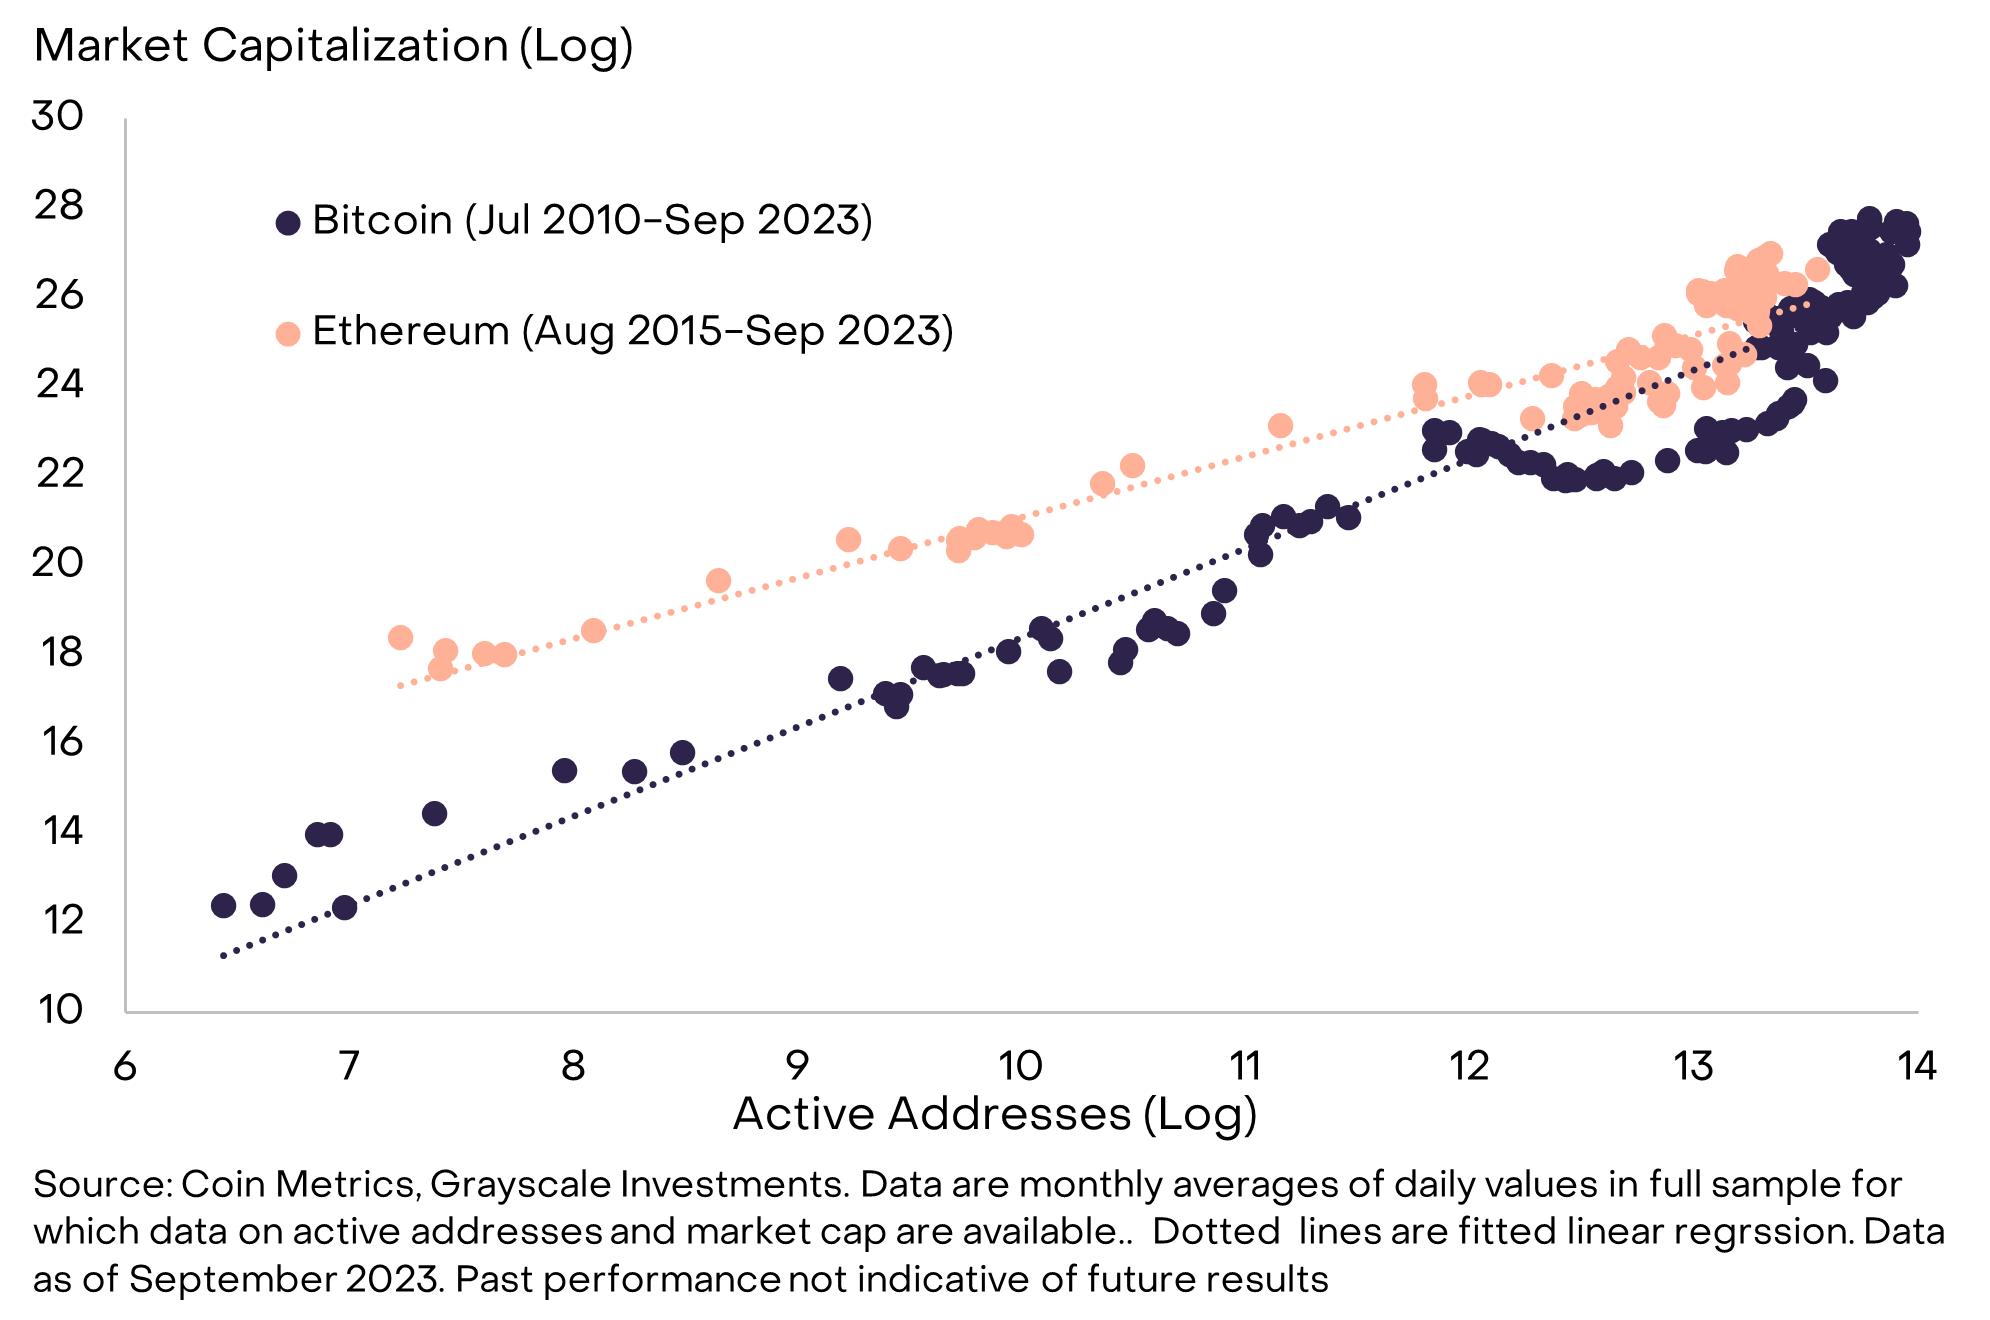
For longer-running projects, data on market capitalization and users show a similar pattern over time. For example, Exhibit 3 plots active addresses (a proxy for network users) and market capitalization for Bitcoin and Ethereum.[8] Again we observe a positive correlation between network size and market capitalization. For Bitcoin, the slope of the fitted line equals 2.0. Because the values are expressed in logarithmic scale, this means that a 1% increase in the number of active addresses equates to a 2% increase in market capitalization—the magnitude of network effect predicted by Metcalfe’s Law. For Ethereum, the slope of the fitted line equals 1.4, also implying a nonlinear relationship between network size and network value.
Exhibit 3: Bitcoin and Ethereum market caps have tracked user adoption
Implications for Investors
The fact that public blockchains are network technologies with observable network effects has a number of implications for crypto investors. Most importantly, these patterns can help explain why we may see outsized token returns if network adoption continues to grow. Like social media platforms, blockchains that reach a critical mass of network participants typically would see value grow more than one-for-one with the number of users (up to the point of diminished marginal returns).
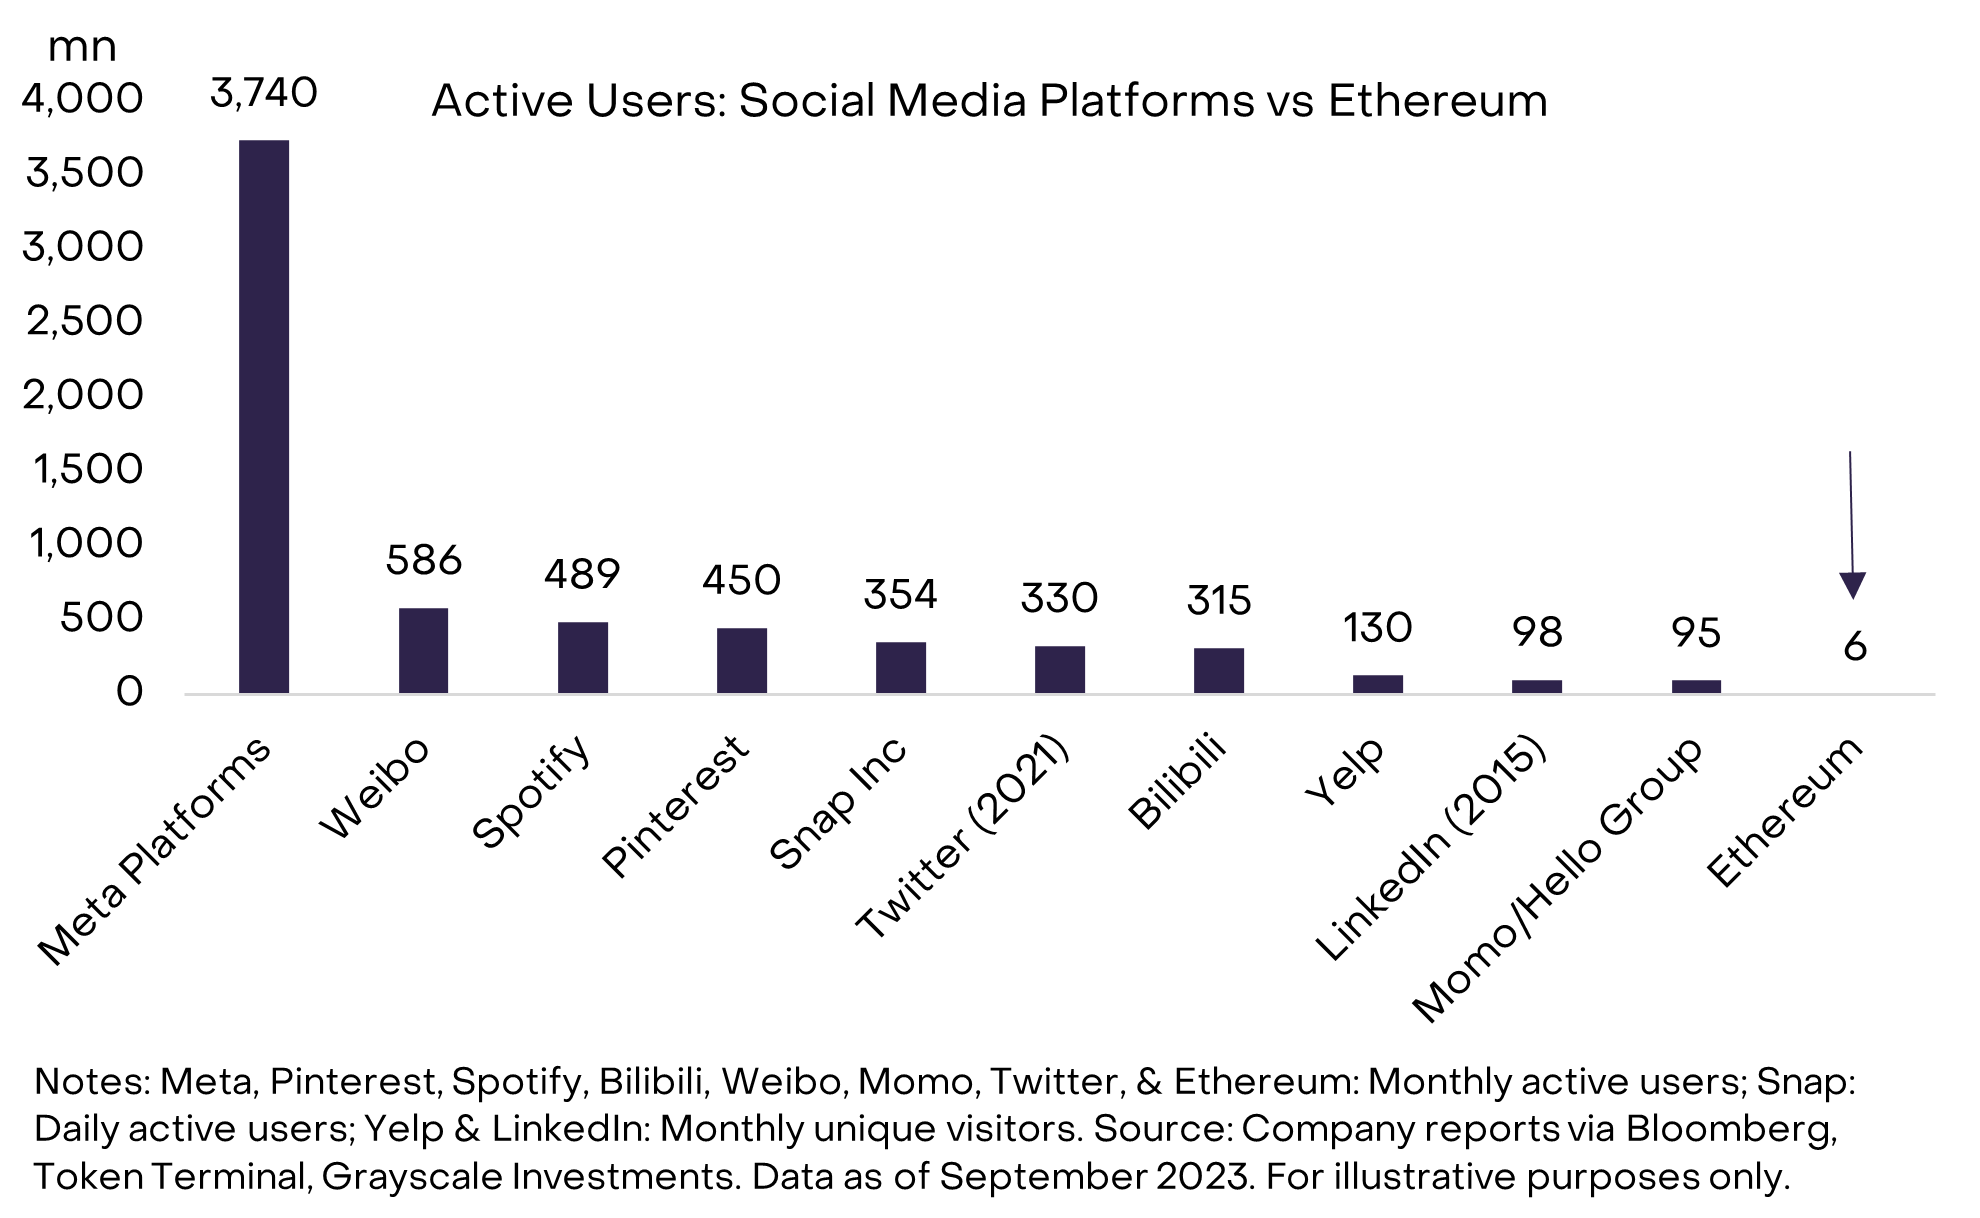
At Grayscale, we believe we are approaching this moment for a number of public blockchains and their associated tokens. Although blockchain adoption has grown steadily over time, the number of users of the largest chains today are still very low compared to mainstream social media platforms. According to data from Token Terminal, Ethereum has just 6.1 million monthly active users.[9] To put this into context, the number of monthly unique visitors to Yelp is more than 20 times higher (Exhibit 4). If Ethereum or other blockchains can garner mainstream adoption, the number of additional potential users would be very large. And, because of the nonlinear relationship between adoption and network value, the implication for token valuations could be meaningful.
Exhibit 4: Ethereum adoption still very low compared to major social media applications
Risks and Limitations
It is important to stress a number of caveats to this analysis. First, positive network effects can be offset by network congestion. For the Ethereum mainnet in particular, greater network usage has been associated with rising user cost in the form of gas fees. This is why scaling solutions are so important to the future of the project: unless Ethereum can onboard more users while controlling cost it will not likely benefit from nonlinear network effects.
Second, we do not yet fully understand how competition among blockchains will play out, especially for the smart contract platform category. If it is easy for consumers to switch between networks, it may be harder for any one project to dominate the market and potentially benefit from network effects. Moreover, even if eventual market dominance is attractive for a token’s investors, the resulting concentration could have negative implications for competition and possibly users.
Third, network effects can work in reverse. If rising user adoption can result in nonlinear increases in value, falling user adoption can result in nonlinear declines in value (“death spirals”). Network effects help defend incumbents, but do not necessarily insulate them from competitors offering superior products.
Lastly, the analysis here focuses on the potential impact of user adoption on network value. In general, we think the direction of causality works this way. However, for any investment asset, high returns can also induce additional demand from speculative traders (which may partly explain why there is momentum in Bitcoin’s price). User adoption needs to reflect non-speculative use cases for networks to have sustained value.
Investing in network technologies like public blockchains requires an understanding of network effects. Network effects predict that size will be an important determinant of network value: like in many information technology industries, bigger is better. Therefore, active addresses and other measures of blockchain users should be considered an important fundamental for token prices. Moreover, network effects suggest that token valuations may experience nonlinear increases with growing adoption (up to the point of diminishing marginal returns).
[1] Economists also refer to this phenomenon as “network externalities” or “demand-side economies of scale”, to contrast with supply-side economies of scale in traditional manufacturing industries. For additional background on these topics see, for example, The Economics of Information Technology: An Introduction, by Hal Varian, Joseph Farrell, and Carl Shapiro, 2004.
[2] See, for example, Nobuhiro Kiyotaki and Randall Wright, “On Money as a Medium of Exchange”, Journal of Political Economy, 1989; or Marc Flandreau and Clemens Jobst, “The Empirics of International Currencies: Network Externalities, History, and Persistence”, The Economic Journal, April 2009.
[3] Robert Metcalfe, “Metcalfe’s Law after 40 Years of Ethernet.” Computer, December 2013.
[4] See, for example, Antonio Scala and Marco Delmastro, “The Explosive Value of the Networks.” Nature, August 2022.
[5] This extends beyond information technology to other network goods. Economist Charles Kindleberger famously noted: “For better or worse—and opinions differ on this—the choice of which language and which currency is made not on merit, or moral worth, but on size.”
[6] Data for March 2023 through September 2023, when active users and market cap were available for the selected tokens.
[7] This figure is the point on the fitted line where the slope equals one.
[8] We exclude two ten-day periods in Q4 2016 when Ethereum active addresses were very high, and should be treated as outliers.
[9] As of September 2023; Token Terminal defines active users as active sender addresses.
ARTICLE DISCLOSURES
Investments in digital assets are speculative investments that involve high degrees of risk, including a partial or total loss of invested funds. Investments in digital assets are not suitable for any investor that cannot afford loss of the entire investment.
All content is original and has been researched and produced by Grayscale Investments, LLC (“Grayscale”) unless otherwise stated herein. No part of this content may be reproduced in any form, or referred to in any other publication, without the express consent of Grayscale.
This information should not be relied upon as research, investment advice, or a recommendation regarding any products, strategies, or any investment in particular. This material is strictly for illustrative, educational, or informational purposes and is subject to change. This content does not constitute an offer to sell or the solicitation of an offer to sell or buy any security in any jurisdiction where such an offer or solicitation would be illegal. There is not enough information contained in this content to make an investment decision and any information contained herein should not be used as a basis for this purpose.
This content does not constitute a recommendation or take into account the particular investment objectives, financial situations, or needs of investors.
Logarithmic scale is defined as a method for graphing and analyzing a large range of values in a compact form
Investors are not to construe this content as legal, tax or investment advice, and should consult their own advisors concerning an investment in digital assets. The price and value of assets referred to in this content and the income from them may fluctuate. Past performance is not indicative of the future performance of any assets referred to herein. Fluctuations in exchange rates could have adverse effects on the value or price of, or income derived from, certain investments.
Certain of the statements contained herein may be statements of future expectations and other forward-looking statements that are based on Grayscale’s views and assumptions and involve known and unknown risks and uncertainties that could cause actual results, performance, or events to differ materially from those expressed or implied in such statements. In addition to statements that are forward-looking by reason of context, the words “may, will, should, could, can, expects, plans, intends, anticipates, believes, estimates, predicts, potential, projected, or continue” and similar expressions identify forward-looking statements. Grayscale assumes no obligation to update any forward-looking statements contained herein and you should not place undue reliance on such statements, which speak only as of the date hereof. Although Grayscale has taken reasonable care to ensure that the information contained herein is accurate, no representation or warranty (including liability towards third parties), expressed or implied, is made by Grayscale as to its accuracy, reliability, or completeness. You should not make any investment decisions based on these estimates and forward-looking statements.
There is no guarantee that the market conditions during the past period will be present in the future. Rather, it is most likely that the future market conditions will differ significantly from those of this past period, which could have a materially adverse impact on future returns. NO REPRESENTATION IS BEING MADE THAT ANY ACCOUNT WILL OR IS LIKELY TO ACHIEVE PROFITS OR LOSSES SIMILAR TO THOSE SHOWN. PAST PERFORMANCE IS NOT INDICATIVE OF FUTURE RESULTS. We selected the timeframe for our analysis because we believe it broadly constitutes the most complete historical dataset for the digital assets that we have chosen to analyze.