Grayscale Research Insights: Crypto Sectors in Q4 2025

Research Team
Last Updated: 9/25/2025 | 12 min. read
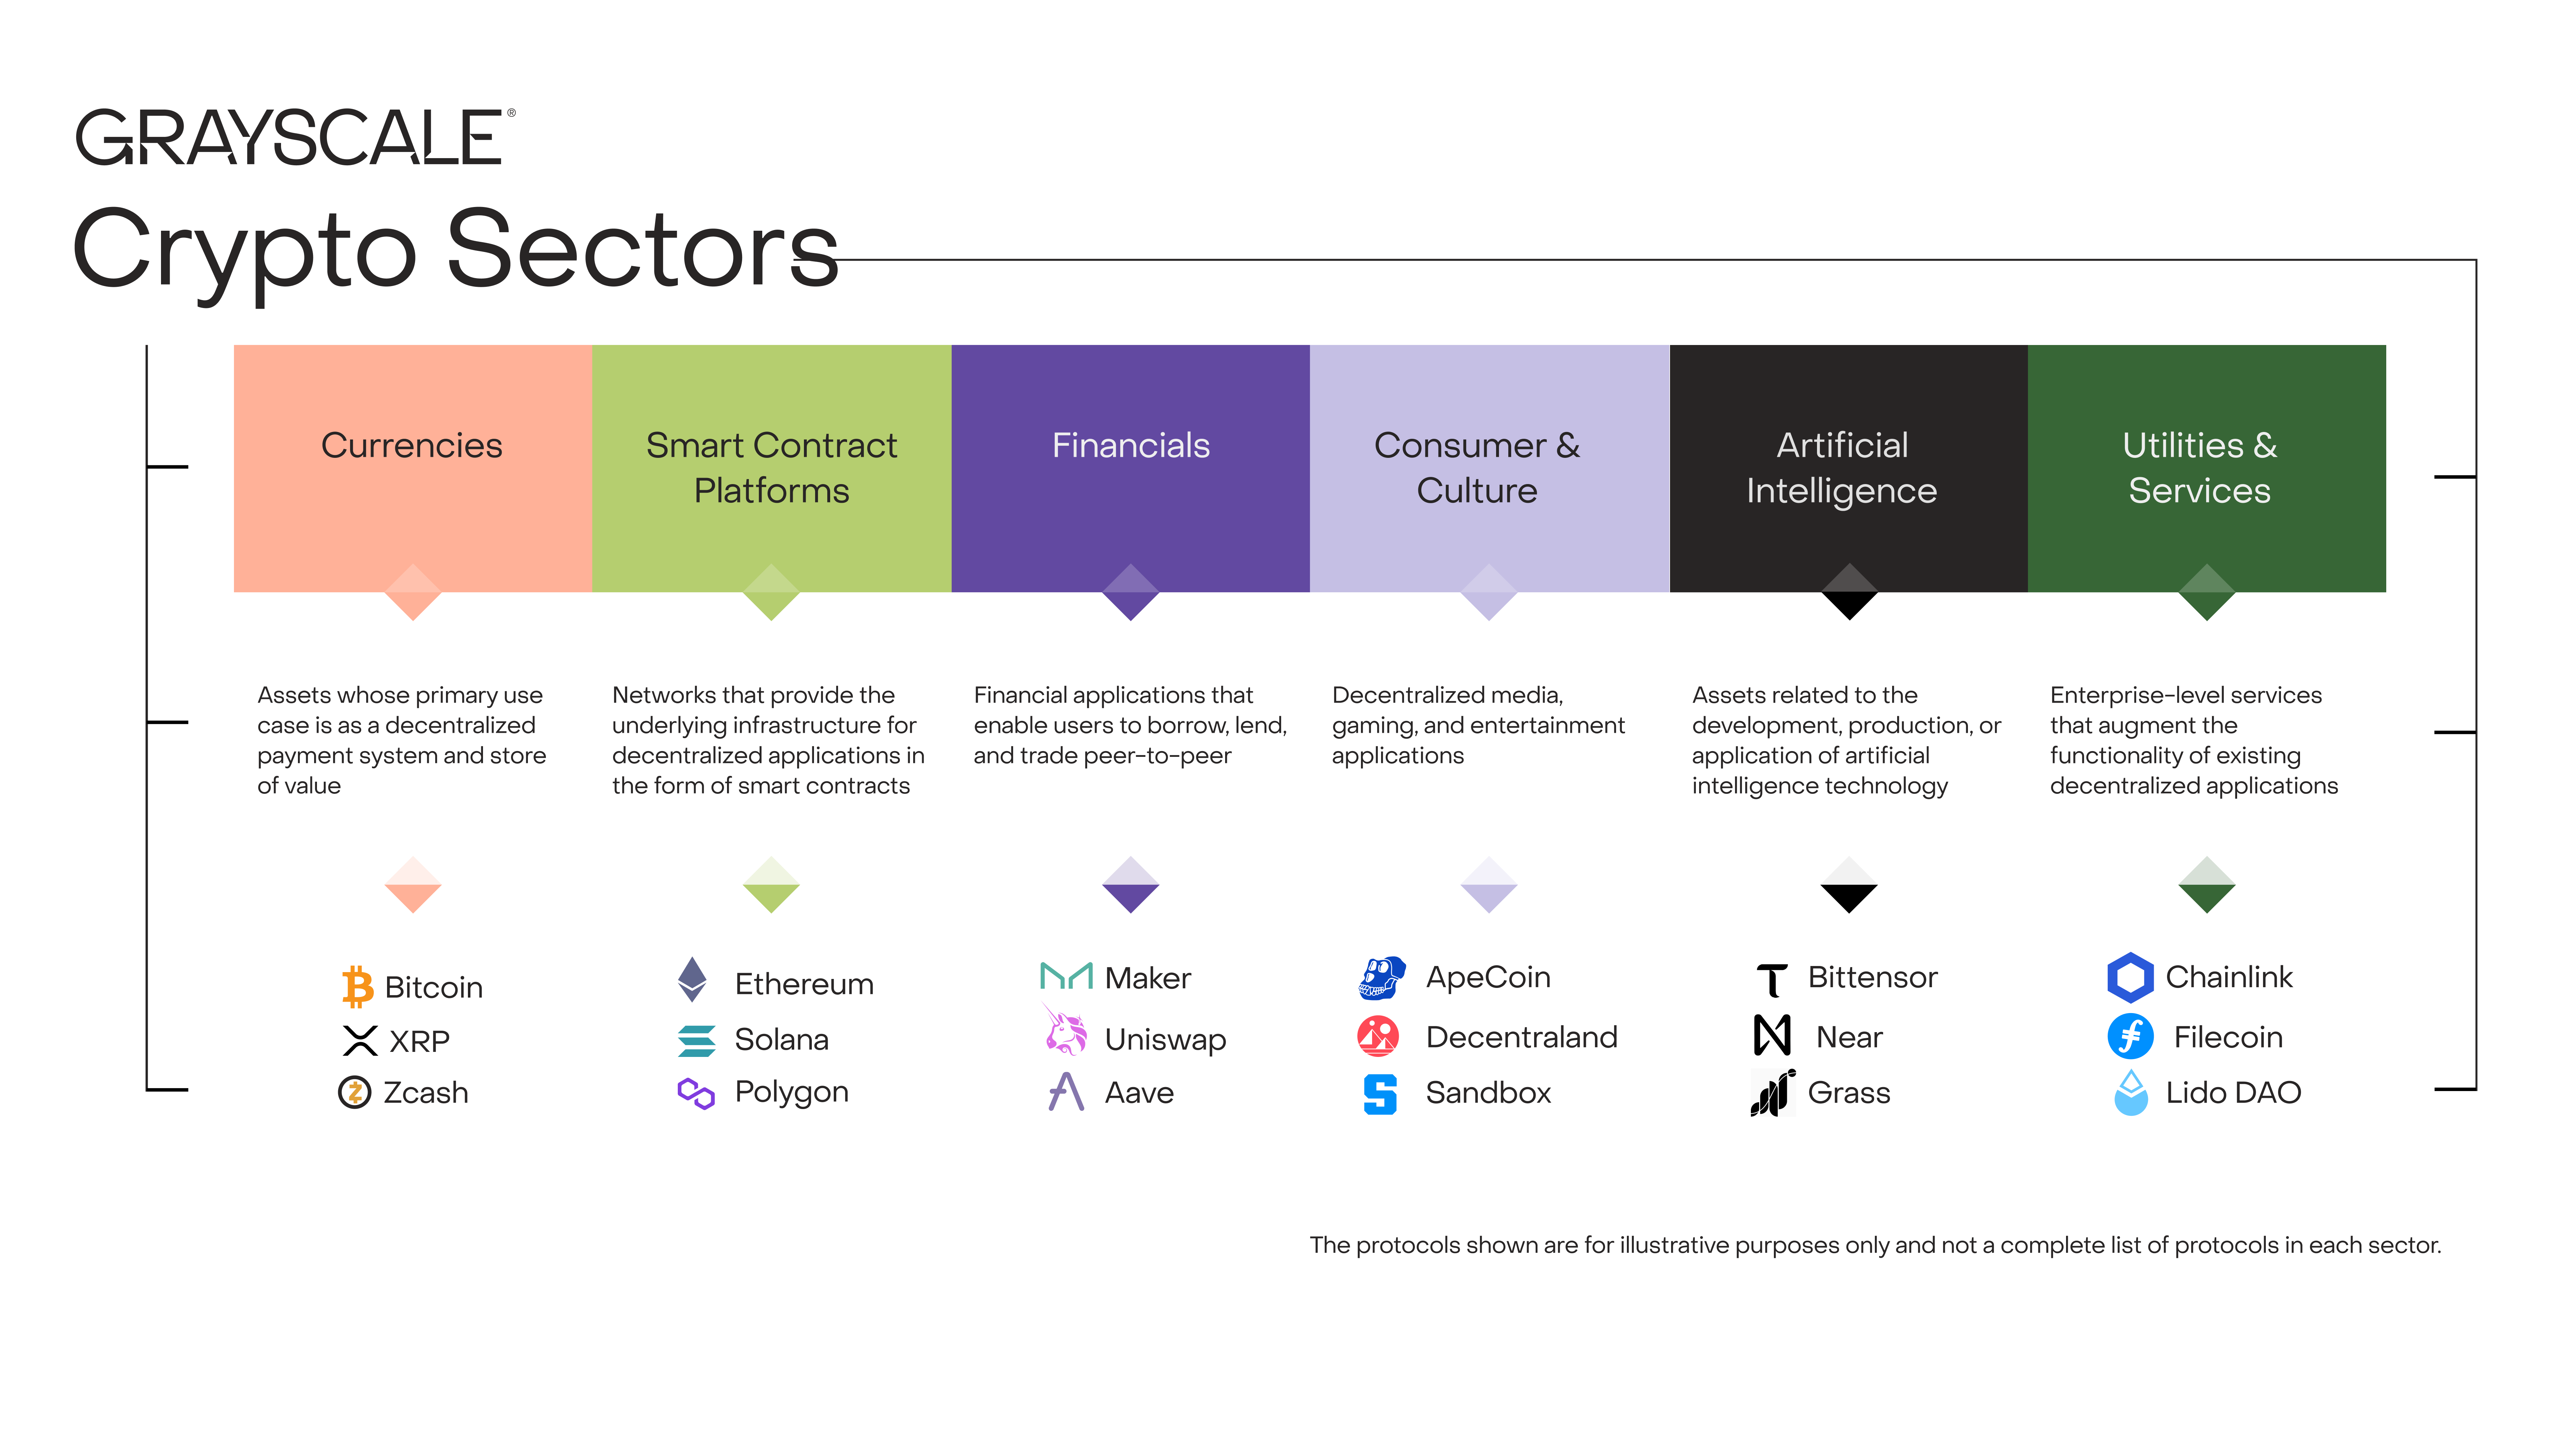
Every asset in crypto is somehow related to blockchain technology and shares the same basic market structure — but that’s where the commonalities end. The asset class includes a wide array of software technologies with applications in consumer finance, artificial intelligence (AI), media and entertainment, and other fields. To keep things organized, Grayscale Research uses a proprietary taxonomy and family of indexes known as Crypto Sectors, developed in partnership with FTSE/Russell. The Crypto Sectors framework covers six distinct market segments (Exhibit 1). Together they include 261 tokens and have a combined market cap of $3.5 trillion.[1]
Exhibit 1: Crypto Sectors framework helps organize digital asset markets
Measuring Blockchain Fundamentals
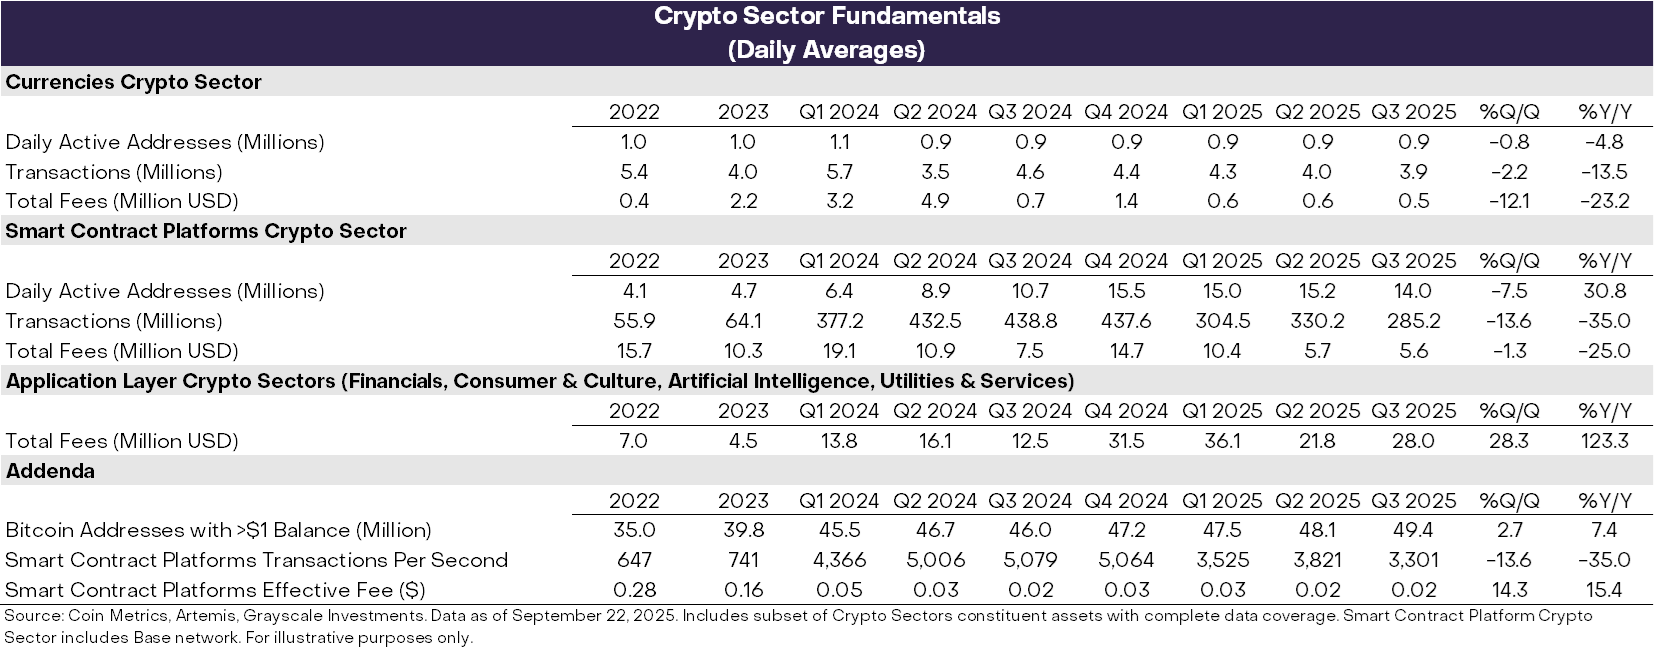
Blockchains are not businesses, but it is possible to measure their economic activity and financial health in an analogous way. The three most important measures of on-chain activity are users, transactions, and transaction fees. Because blockchains are pseudonymous, analysts typically use “active addresses” (blockchain addresses with at least one transaction) as an imperfect proxy for the number of users.
Fundamental measures of blockchain health were mixed during Q3 (Exhibit 2). On the negative side, users, transactions, and fees were lower quarter over quarter (QoQ) for both the Currencies and Smart Contract Platforms Crypto Sectors. In general, speculative activity related to memecoins has declined since Q1 2025, and this has contributed to both lower trading volume and lower transaction activity.
More encouragingly, fees for blockchain-based applications increased 28% QoQ. This growth was driven by a concentration of activity in a handful of leading applications by fee revenue: (i) Jupiter, a decentralized exchange on Solana; (ii) Aave, crypto’s leading borrowing and lending protocol; and (iii) Hyperliquid, the leading perpetual futures exchange. On an annualized basis, application-layer fee revenue now exceeds $10 billion. Blockchains are both networks for digital transactions and platforms for applications. Therefore, higher application fees could be considered a sign of rising adoption of blockchain technology.
Exhibit 2: Fundamentals were mixed across Crypto Sectors during Q3 2025
Tracking Price Performance
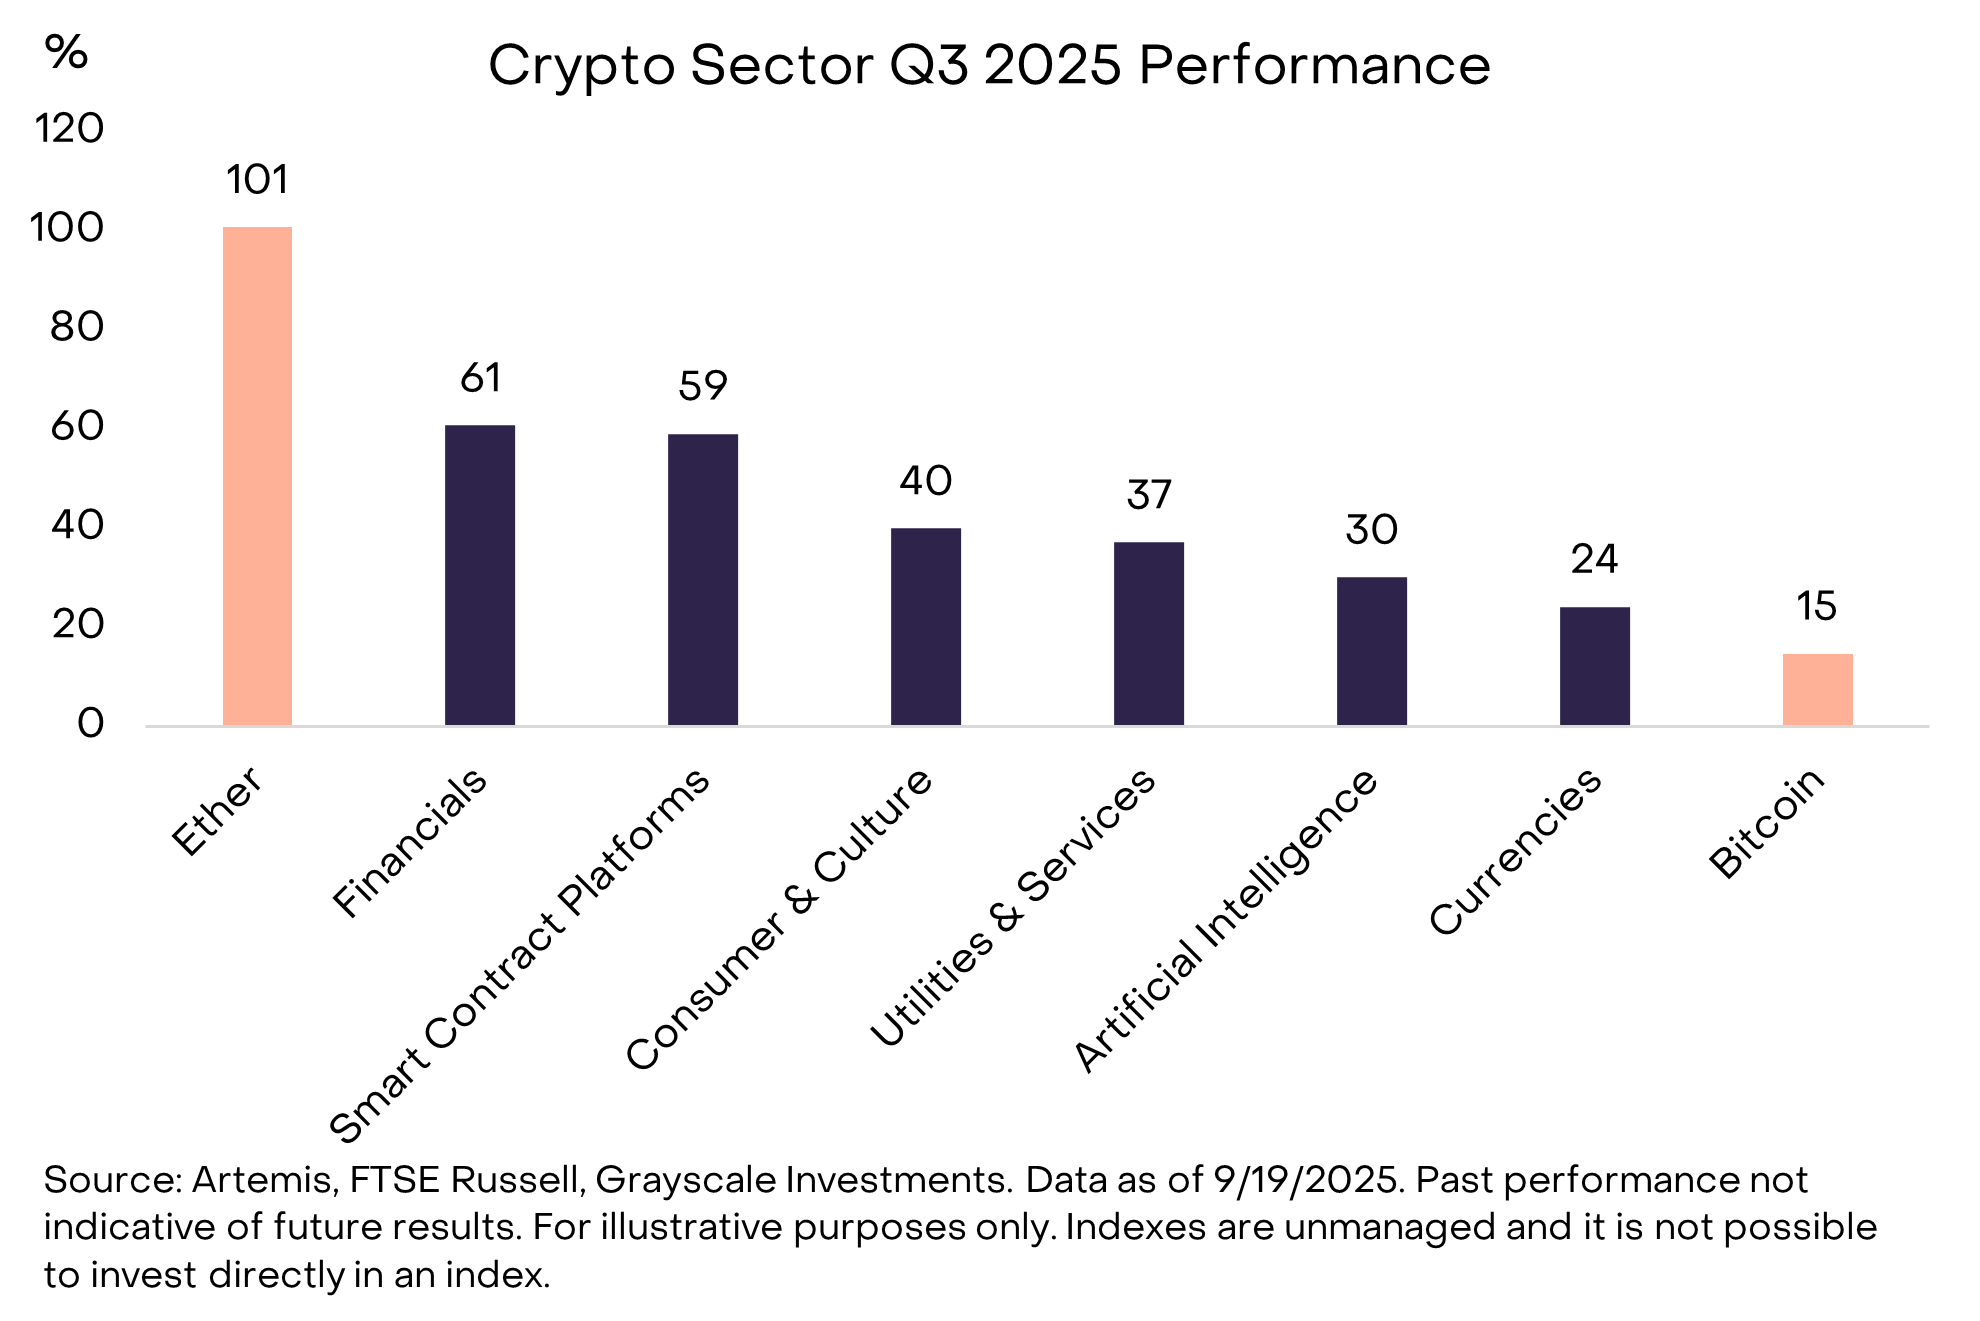
Crypto asset returns were positive across all six Crypto Sectors in Q2 2025 (Exhibit 3). Bitcoin underperformed other market segments, and the pattern of returns could be considered a crypto “alt season” — although distinct from other periods of falling Bitcoin dominance in the past.[2] The Financials Crypto Sector led the way, boosted by rising centralized exchange (CEX) volume, while the Smart Contract Platforms Crypto Sector likely benefited from stablecoin legislation and adoption (smart contract platforms are the networks over which users make peer-to-peer payments using stablecoins). While all Crypto Sectors produced positive returns, the AI Crypto Sector lagged other market segments, mirroring a period of lackluster returns in AI equities. The Currencies Crypto Sector also underperformed, reflecting the relatively modest gain in Bitcoin’s price.
Exhibit 3: Bitcoin underperformed other crypto market segments
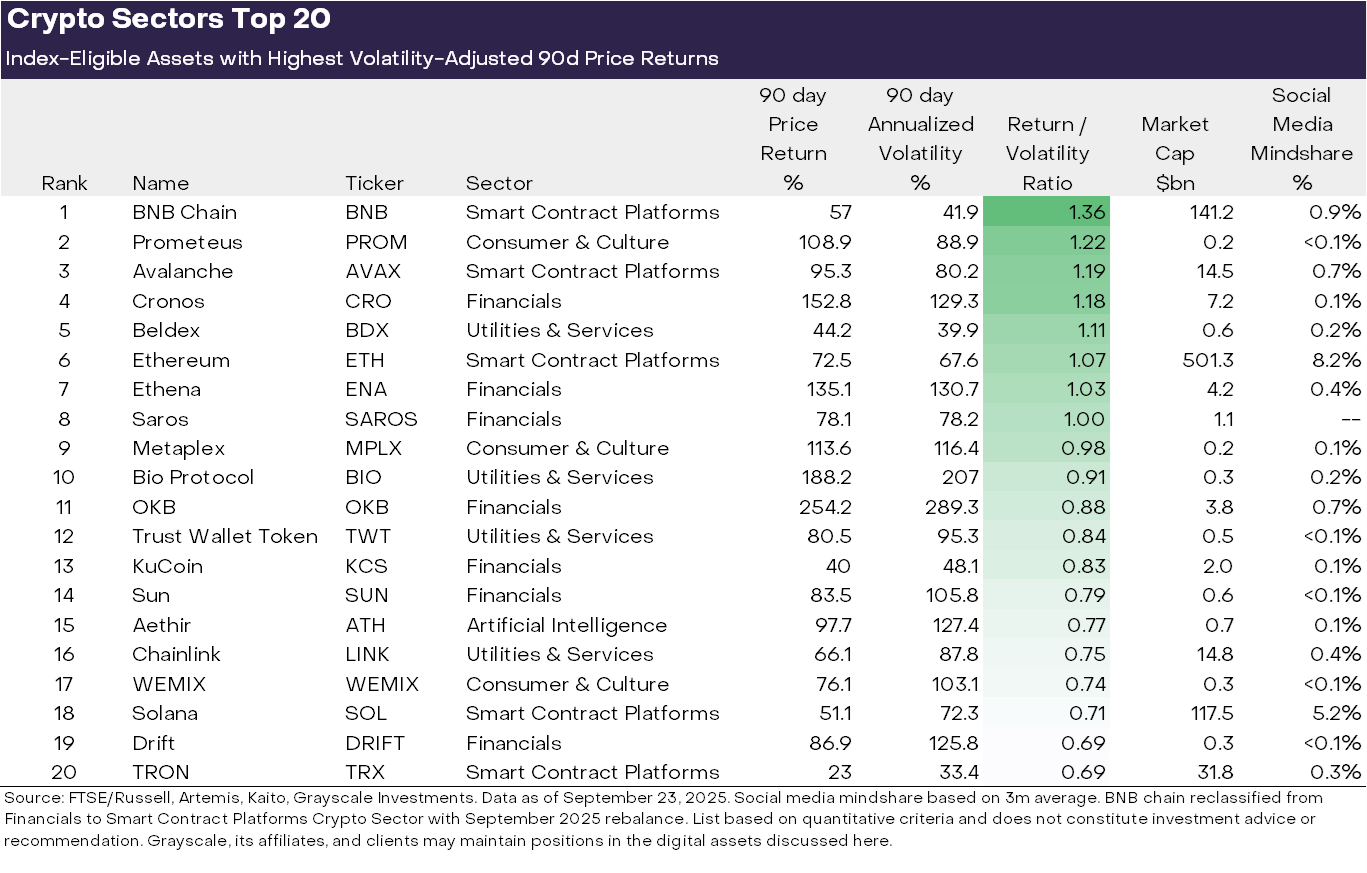
The diversity of the crypto asset class means that there are frequent changes in dominant themes and shifts in market leadership. In Exhibit 3, we display the top 20 index-eligible[3] tokens for Q3 2025 based on volatility-adjusted price returns. The list features several large-cap tokens (>$10 billion market cap), including ETH, BNB, SOL, LINK, and AVAX, as well as a few with market caps less than $500 million. The Financials Crypto Sector (seven assets) and Smart Contract Platforms Crypto Sector (five assets) were the most represented on the top 20 list this quarter.
Exhibit 4: Top-performing assets in Crypto Sectors by risk-adjusted returns
In our view, three main themes stand out from recent market performance:
(1) Digital asset treasuries (DATs): Last quarter saw a proliferation of DATs: public companies that hold crypto on balance sheet and serve as an exposure vehicle for equity investors. Several of the tokens featured in the top 20 list may have benefited from the creation of new DATs, including ETH, SOL, BNB, ENA, and CRO.
(2) Stablecoin adoption: Another major theme last quarter was stablecoin legislation and adoption. On July 18, President Trump signed into law the GENIUS Act, new legislation that provides a comprehensive regulatory framework for stablecoins in the U.S. (see our report Stablecoins and the Future of Payments). Following the bill’s passage, stablecoin adoption accelerated, with circulating supply rising 16% to more than $290 billion (Exhibit 4).[4] The primary beneficiaries were the smart contract platforms that host stablecoins, including ETH, TRX, and AVAX — the latter of which saw a notable surge in stablecoin transaction volume. Stablecoin issuer Ethena (ENA) also saw strong price returns, even though its USDe stablecoin does not conform to GENIUS Act requirements (USDe is used heavily in decentralized finance, and Ethena has launched a new GENIUS Act-compliant stablecoin).[5]
Exhibit 5: Stablecoin supply grew this quarter, led by Ethereum
(3) Rising exchange volume: Exchanges were another major theme, as August recorded the highest monthly centralized exchange trading volumes since January (Exhibit 5).[6] This increase in activity seemed to benefit several assets associated with centralized exchanges — including BNB, CRO, OKB, and KCS — all of which ranked in the top 20 (in some cases these assets are also tied to smart contract platforms).[7]
Meanwhile, decentralized perpetual futures continued to gain momentum (for background, see DEX Appeal: The Rise of Decentralized Exchanges). Leading perpetuals exchange Hyperliquid grew sharply and became a top three crypto asset by fee revenue this quarter.[8] DRIFT, a smaller competitor, made the Crypto Sectors Top 20 after a large uptick in volume.[9] Another decentralized perps protocol, ASTER, launched in mid-September and grew from $145 million in market cap to $3.4 billion in market cap in just a week.[10]
Exhibit 6: CEX perpetuals volume reached its highest this year in August
During Q4, returns across Crypto Sectors may be driven by a distinct set of themes. First, relevant committees in the U.S. Senate have taken up crypto market structure legislation, after a related bill passed the House of Representatives with bipartisan support in July. This represents comprehensive financial services legislation for the crypto industry and could be a catalyst for deeper integration with the traditional financial services industry. Second, the Securities and Exchange Commission (SEC) has approved generic listing standards for commodity-based exchange-traded products (ETPs).[11] This may result in an increase in the number of crypto assets accessible to U.S. investors through the ETPs structure.
Finally, the macro backdrop could continue to evolve. Last week the Federal Reserve approved a quarter-point rate cut and signaled the potential for two more later this year. Holding all else equal, crypto assets should be expected to benefit from Fed rate cuts (because rate cuts lower the opportunity cost of holding non-interest-bearing currencies and can support investor risk appetite). At the same time, weakness in the U.S. labor market, elevated equity market valuations, and geopolitical uncertainty can be considered sources of downside risk heading into Q4.
Index Definitions: The FTSE/Grayscale Crypto Sectors Index (CSMI) measures the price return of digital assets listed on major global exchanges. The FTSE Grayscale Smart Contract Platforms Crypto Sector Index was developed to measure the performance of crypto assets that serve as the baseline platforms, upon which self-executing contracts are developed and deployed. The FTSE Grayscale Utilities and Services Crypto Sector Index was developed to measure the performance of crypto assets that aim to deliver practical and enterprise-level applications and functionalities. The FTSE Grayscale Consumer and Culture Crypto Sector Index was developed to measure the performance of crypto assets that support consumption-centric activities across a variety of goods and services. The FTSE Grayscale Currencies Crypto Sector Index was developed to measure the performance of crypto assets that serve at least one of three fundamental roles: store of value, medium of exchange, and unit of account. The FTSE Grayscale Financials Crypto Sector Index was developed to measure the performance of crypto assets that seek to deliver financial transactions and services. The FTSE Grayscale Artificial Intelligence Crypto Sector Index was developed to measure the protocols for which AI applications are the primary use case.
[1] Source: Artemis, Grayscale Investments. Data as of September 23, 2025.
[2] Altcoins are crypto assets with a lower market cap than Bitcoin.
[3] To be included in Crypto Sectors, tokens must be listed on a minimum number of qualifying exchanges and meet minimum market cap and liquid thresholds.
[4] DeFi Llama, data as of 9/22/2025.
[6] The Block, data as of 9/22/2025.
[7] Certain exchange tokens also benefited from idiosyncratic factors. For example, OKX announced a token buyback and burn program leading to the burn of $26 billion worth of tokens. Source: The Block.
[8] Artemis, data as of 9/22/2025.
[10] CoinMarketCap, data as of 9/23/2025. ASTER launched too late for inclusion in the Crypto Sectors index.
Standard Disclosure
Investments in digital assets are speculative investments that involve high degrees of risk, including a partial or total loss of invested funds. Investments in digital assets are not suitable for any investor that cannot afford loss of the entire investment.
All content is original and has been researched and produced by Grayscale Investments Sponsors, LLC (“Grayscale”) unless otherwise stated herein. No part of this content may be reproduced in any form, or referred to in any other publication, without the express consent of Grayscale.
This information should not be relied upon as research, legal, tax or investment advice, or a recommendation regarding any products, strategies, or any investment in particular. This material is strictly for illustrative, educational, or informational purposes and is subject to change. This content does not constitute an offer to sell or the solicitation of an offer to sell or buy any security in any jurisdiction where such an offer or solicitation would be illegal. There is not enough information contained in this content to make an investment decision and any information contained herein should not be used as a basis for this purpose.
This content does not constitute a recommendation or take into account the particular investment objectives, financial situations, or needs of investors. Grayscale and its employees may hold certain of the digital assets mentioned herein.
The price and value of assets referred to in this content and the income from them may fluctuate. Past performance is not indicative of the future performance of any assets referred to herein. Fluctuations in exchange rates could have adverse effects on the value or price of, or income derived from, certain investments.
Certain of the statements contained herein may be statements of future expectations and other forward-looking statements that are based on Grayscale’s views and assumptions and involve known and unknown risks and uncertainties that could cause actual results, performance, or events to differ materially from those expressed or implied in such statements. In addition to statements that are forward-looking by reason of context, the words “may, will, should, could, can, expects, plans, intends, anticipates, believes, estimates, predicts, potential, projected, or continue” and similar expressions identify forward-looking statements. Grayscale assumes no obligation to update any forward-looking statements contained herein and you should not place undue reliance on such statements, which speak only as of the date hereof. Although Grayscale has taken reasonable care to ensure that the information contained herein is accurate, no representation or warranty (including liability towards third parties), expressed or implied, is made by Grayscale as to its accuracy, reliability, or completeness. You should not make any investment decisions based on these estimates and forward-looking statements.
There is no guarantee that the market conditions during the past period will be present in the future. Rather, it is most likely that the future market conditions will differ significantly from those of this past period, which could have a materially adverse impact on future returns. NO REPRESENTATION IS BEING MADE THAT ANY ACCOUNT WILL OR IS LIKELY TO ACHIEVE PROFITS OR LOSSES SIMILAR TO THOSE SHOWN. PAST PERFORMANCE IS NOT INDICATIVE OF FUTURE RESULTS. We selected the timeframe for our analysis because we believe it broadly constitutes the most complete historical dataset for the digital assets that we have chosen to analyze.
© 2025 Grayscale. All trademarks, service marks and/or trade names (e.g., DROP GOLD®, G™, GRAYSCALE®, GRAYSCALE CRYPTO SECTORS™ and GRAYSCALE INVESTMENTS®) are owned and/or registered by Grayscale.