Beyond Volatility: Rethinking Crypto Risk for Portfolio Managers

Charlie Perkins, CFA Research Associate

Zach PandlGrayscale Head of Research
Last Updated: 11/12/2026 | 20 min. read
Crypto tends to be evaluated through an outdated risk lens. Many allocators still treat Bitcoin as uniquely volatile, assume it behaves as a leveraged risk-asset trade, and view the broader crypto universe as a single undifferentiated exposure. Each assumption deserves a fresh look. Bitcoin’s market structure, investor base, and role within the broader asset class have changed materially over time.
For allocators, the key distinction is between volatility and portfolio risk. Volatility measures how much an asset moves on its own; portfolio risk depends on why it moves, when those moves occur, and whether they overlap with existing exposures. Viewed through a portfolio lens, Bitcoin’s volatility is not merely a risk to minimize; it may also represent a differentiated source of return.
This report examines crypto risk from four angles:
The evidence points to an asset class that has matured faster than many of the frameworks used to assess it. We argue it deserves a risk framework calibrated to what the asset class is today, not what it was a decade ago.
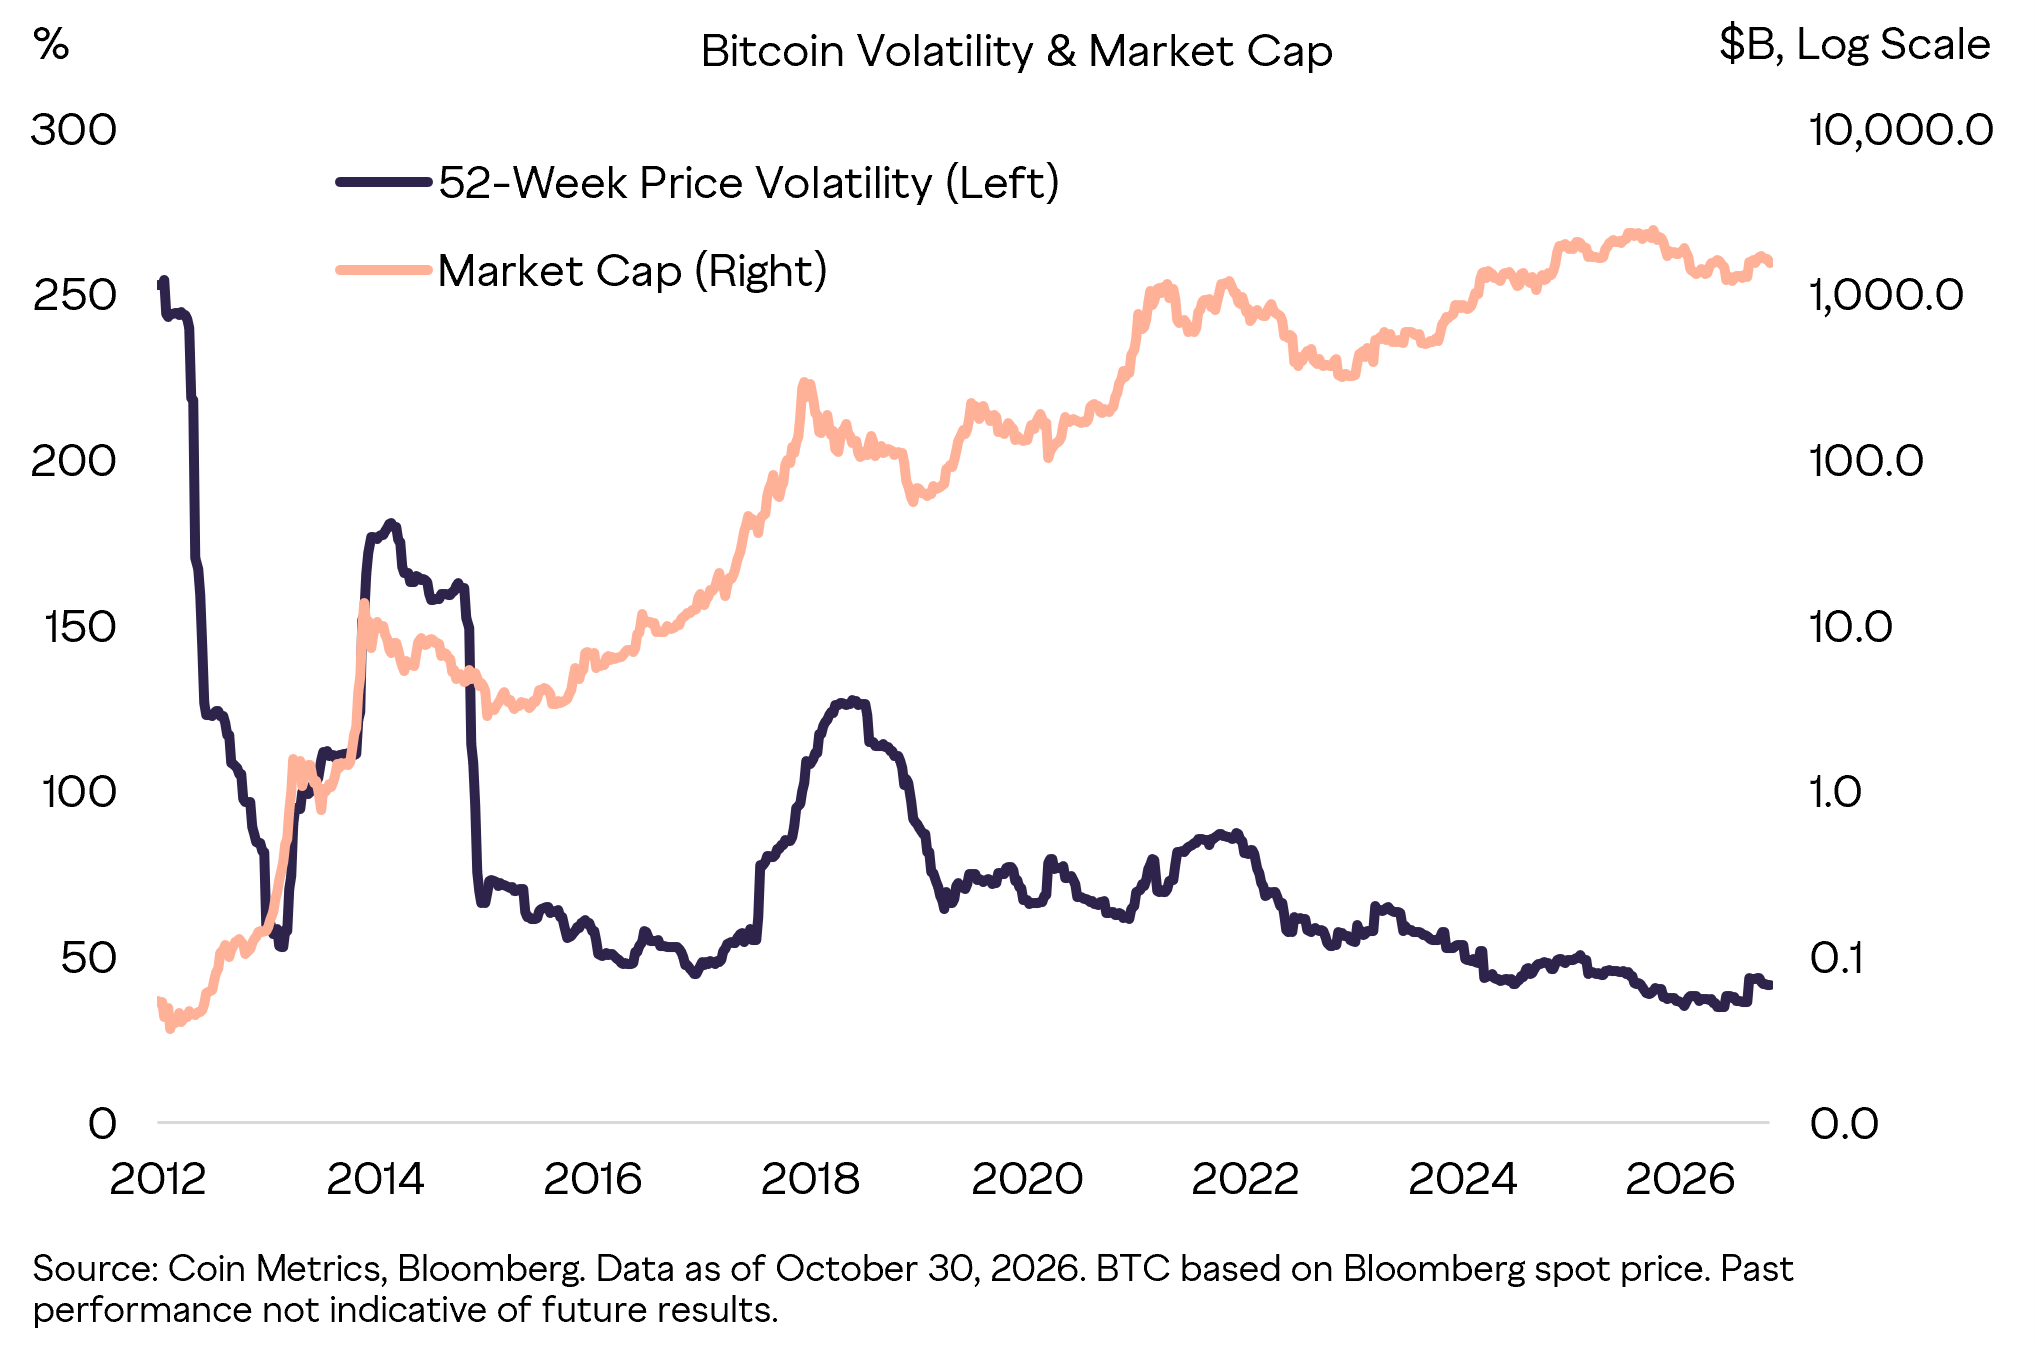
Bitcoin earned its reputation for volatility early. During its early years, volatility routinely exceeded 100% and at times approached 200%, against a market capitalization measured in the single-digit billions.[1] As market value and liquidity have grown over its 18-year life, greater institutional participation, more secure investment vehicles like Bitcoin exchange-traded products (ETPs), and increased regulatory clarity have coincided with a more mature trading environment (Exhibit 1). Realized volatility now sits in the mid-40% range, well below the triple-digit peaks of earlier cycles. The Bitcoin available to investors today presents a different risk profile than it did a decade ago.
Exhibit 1: Bitcoin volatility has declined as market cap has grown
Bitcoin’s volatility is often compared with the S&P 500, but the individual stocks within the index provide a more like-for-like reference point. An index is a portfolio, and its volatility reflects the diversification of hundreds of partially offsetting positions. The individual stocks inside it tell a different story. At roughly 43%, Bitcoin remains more volatile than most S&P 500 constituents, but its volatility is lower than approximately 19% of the index—including several large-cap names investors already hold (Exhibit 2).[2] Bitcoin remains a high-volatility asset, but its volatility is not outside the range observed in public equities.
Exhibit 2: Bitcoin volatility falls within the range of large-cap stocks
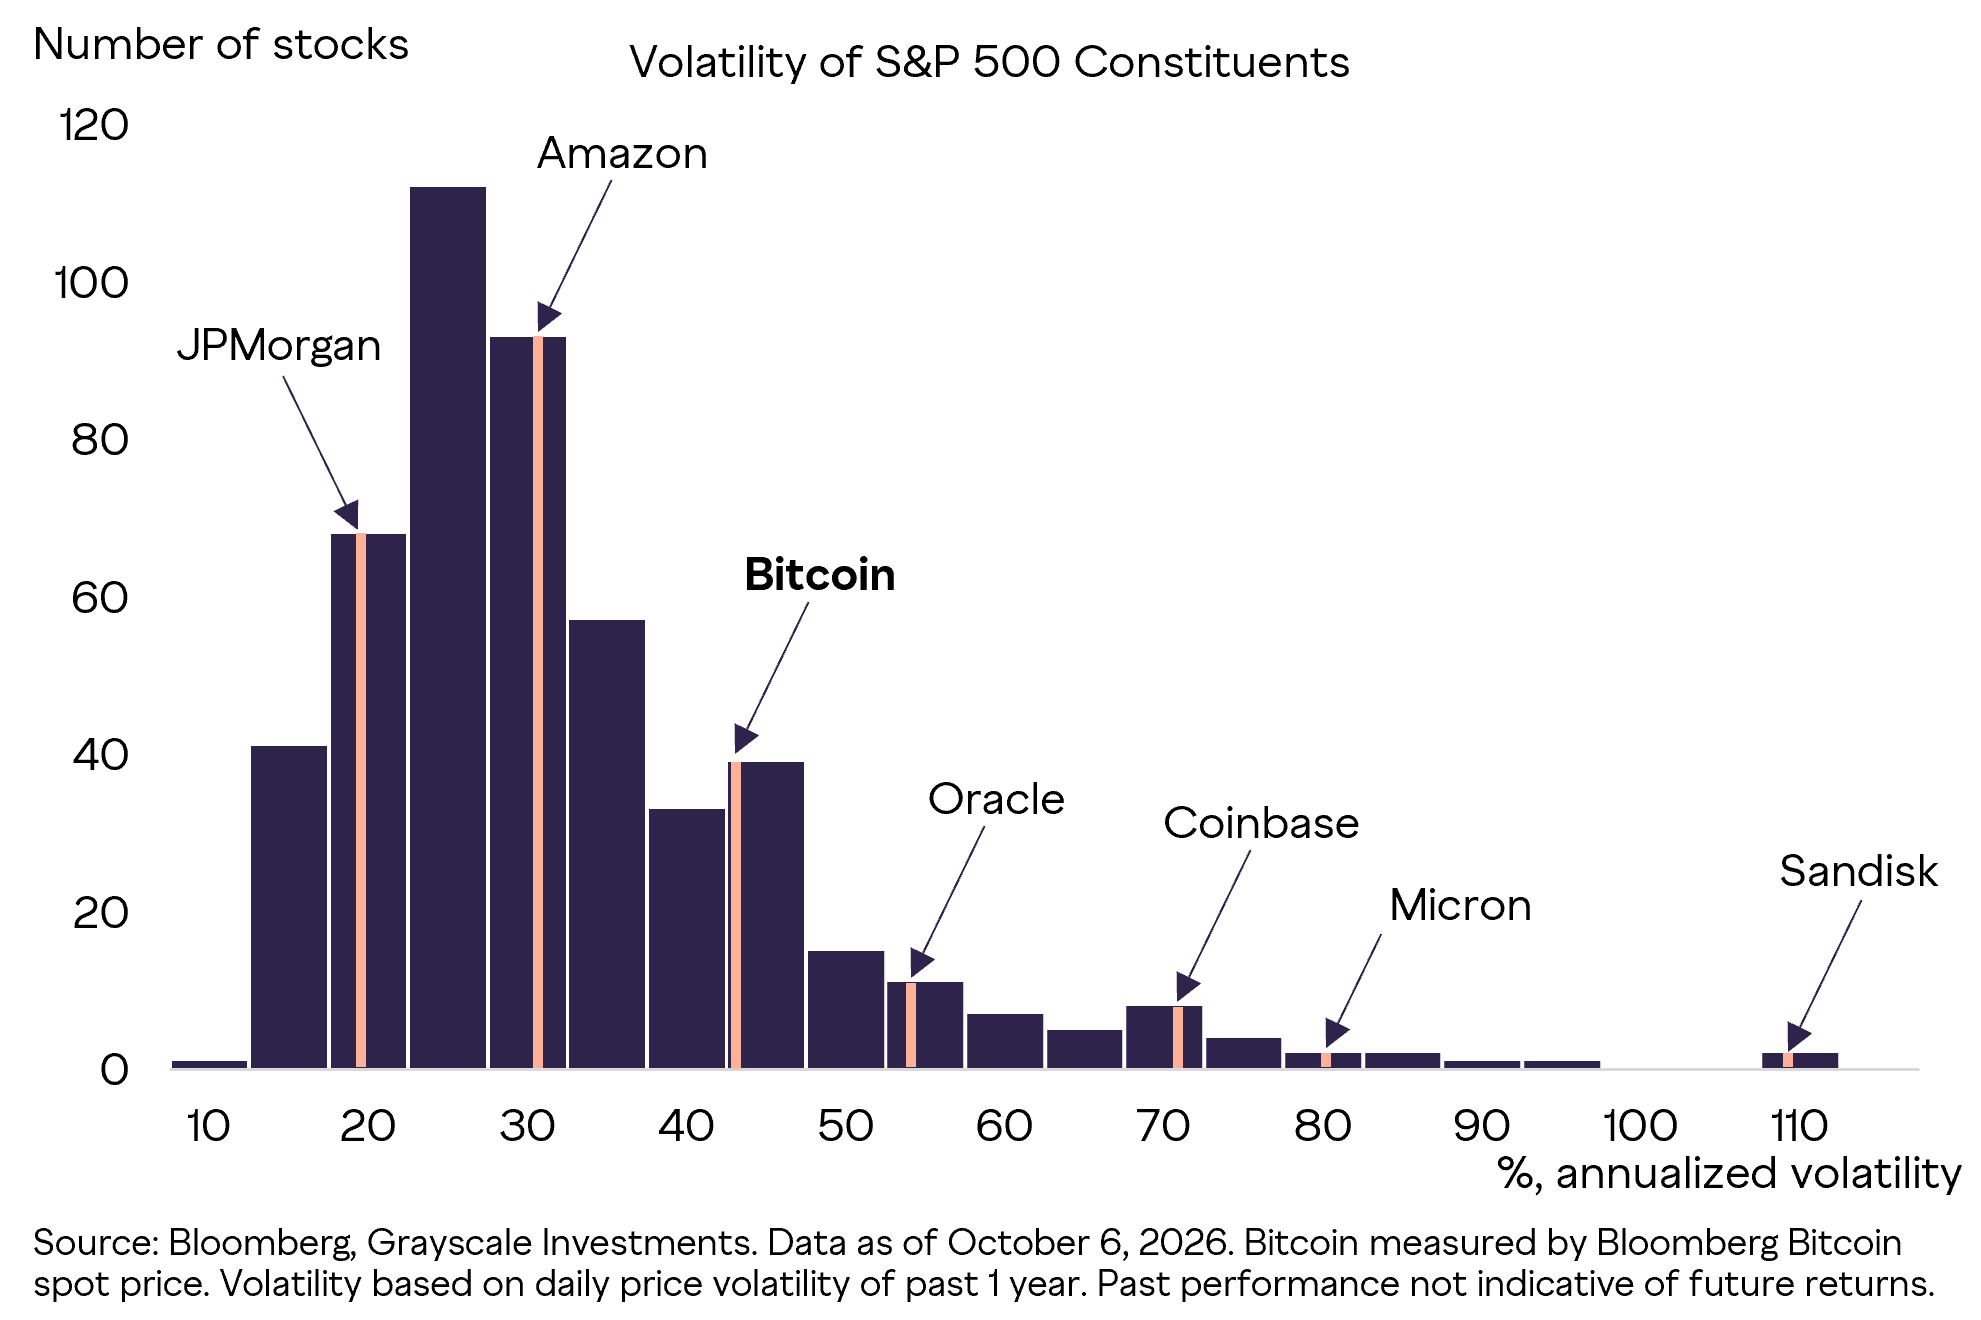
Comparing Bitcoin with individual large-cap stocks does not lead one to conclude that it is a low-risk asset; it simply places the magnitude of its volatility in a more familiar context. The more important question is what lies beneath that headline volatility. Standard deviation alone cannot show whether volatility comes from gains or losses, how frequently extreme returns occur, or whether those returns arrive independently or in clusters. Understanding Bitcoin’s risk therefore requires examining the shape and sequencing of its returns.
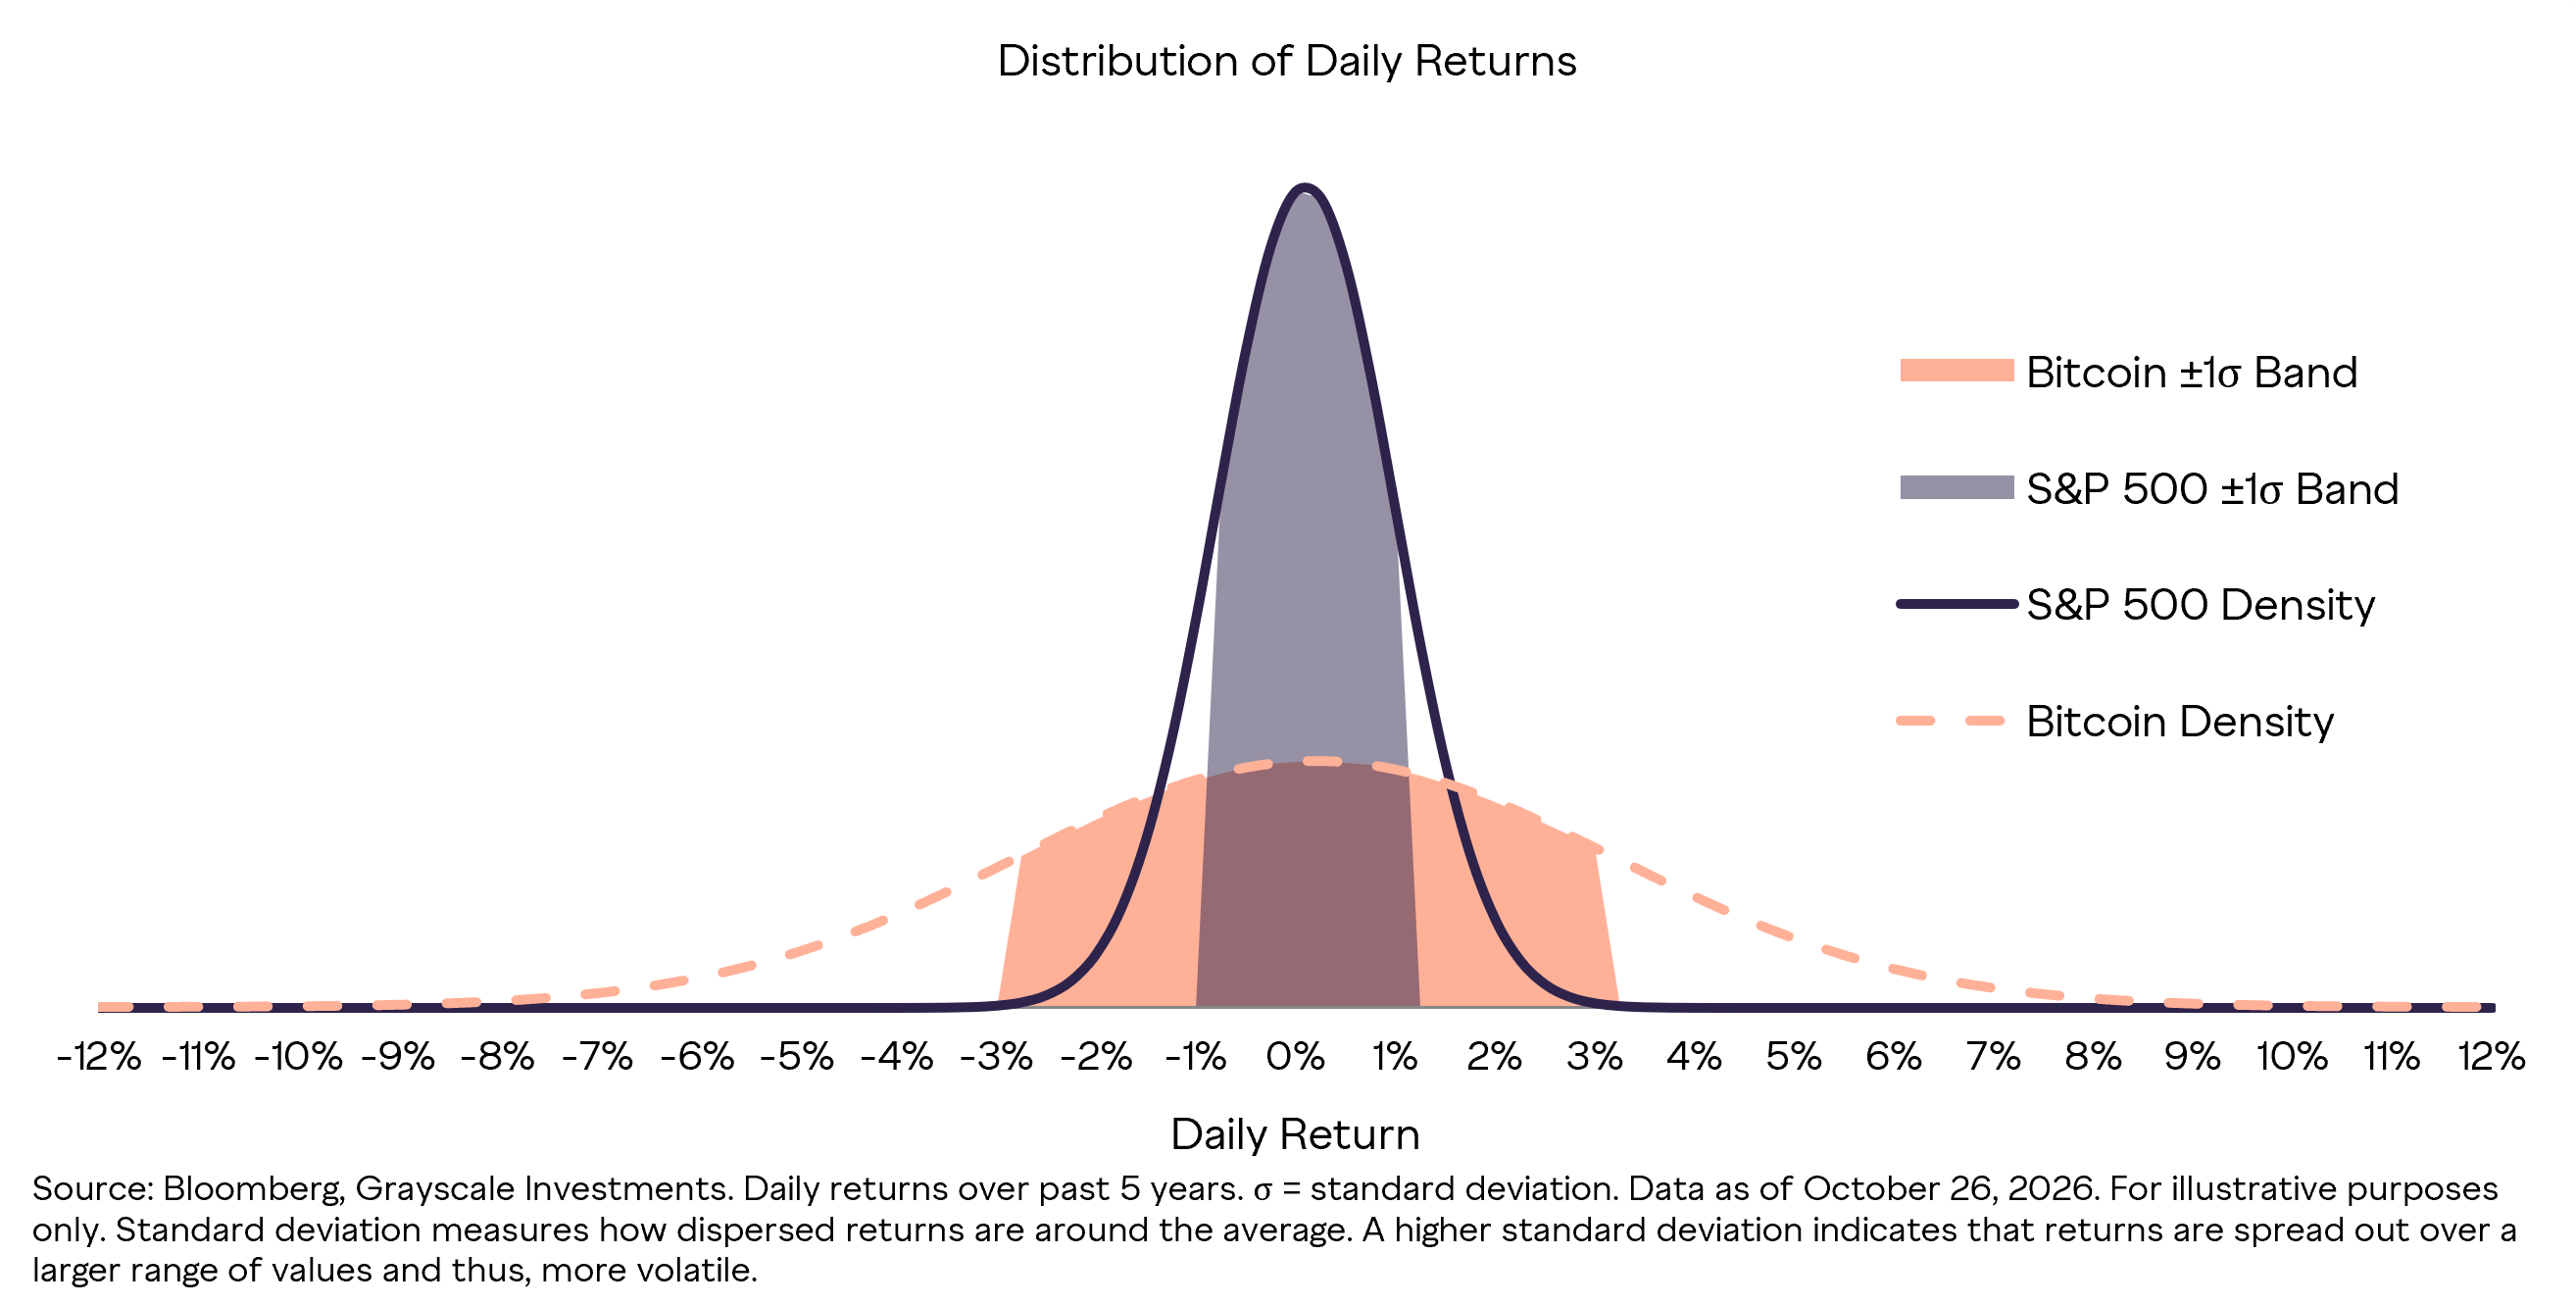
Bitcoin’s daily return distribution is substantially wider and more fat-tailed than that of the S&P 500 (Exhibit 3). Its one-standard-deviation band is roughly three times as wide, while both tails contain more extreme observations than a conventional distribution would suggest. This creates an environment for more severe downside events, but also larger positive returns and a higher average daily return over the period shown. Bitcoin’s volatility, in other words, has historically reflected significant dispersion in both directions.
Exhibit 3: Bitcoin returns have been wider and more fat-tailed than equity returns
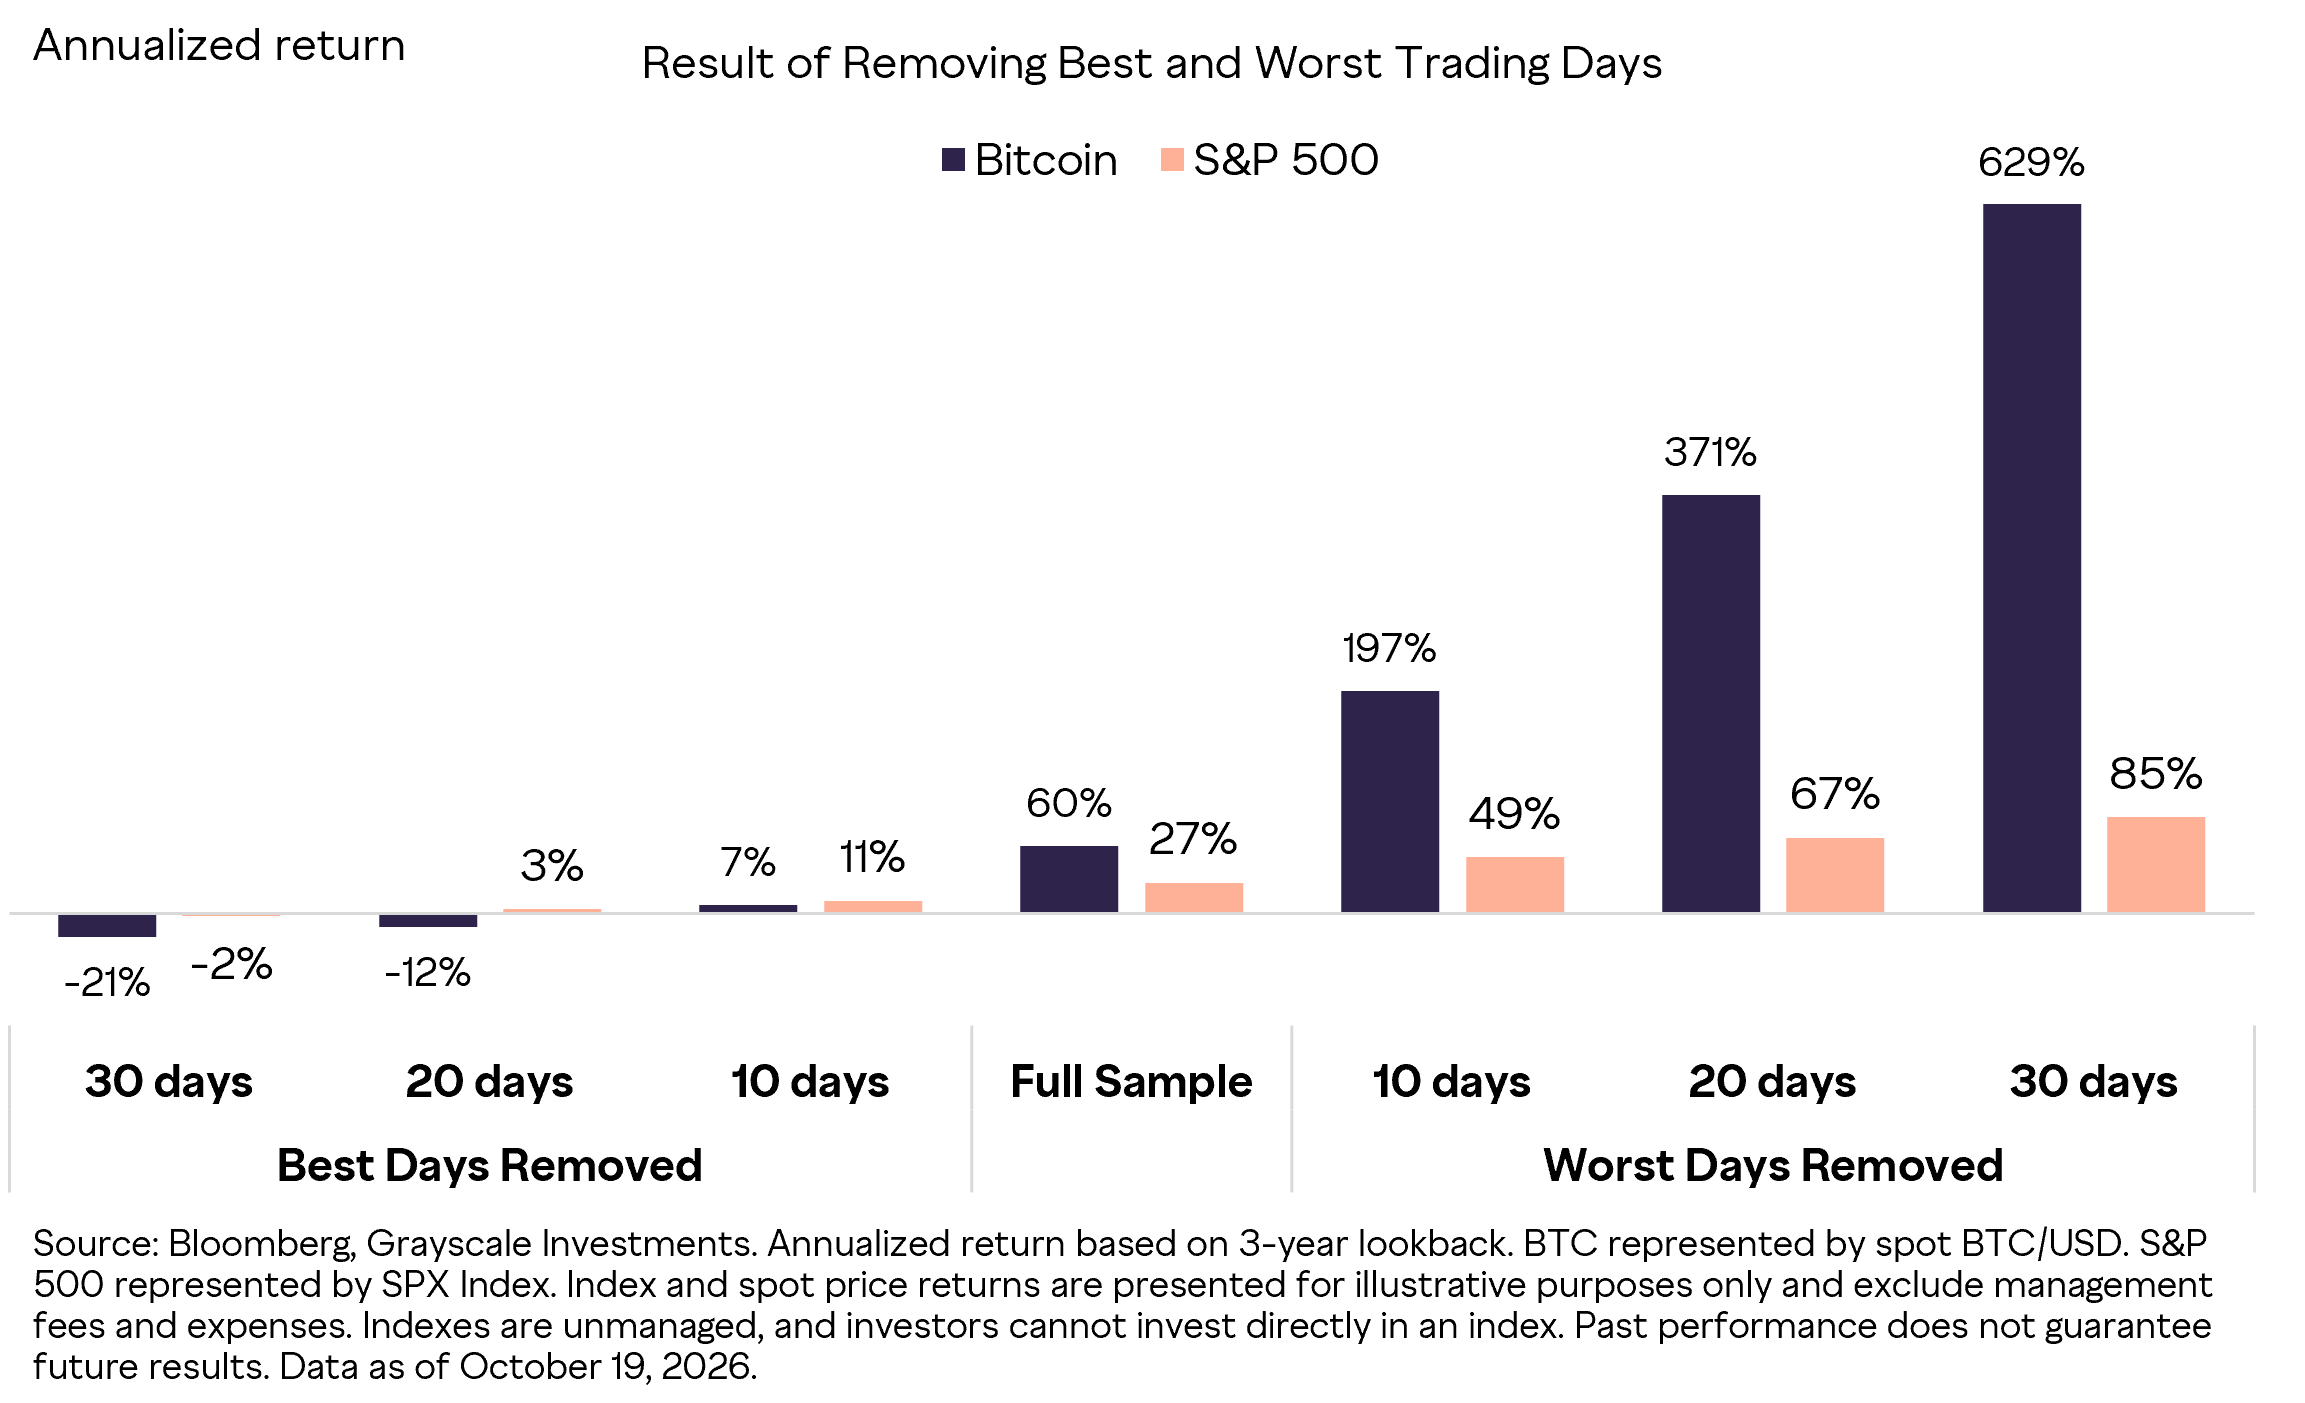
Fat tails matter because a small number of trading days can determine long-term outcomes. Over the past three years, Bitcoin generated a 60% annualized return; removing its 10 best days reduced that figure to 7%, while removing its 10 worst days increased it to 197% (Exhibit 4). This does not suggest those days can be identified in advance. Instead, it demonstrates how costly it can be to miss the sharp rebounds that often accompany Bitcoin’s largest declines.
Exhibit 4: A handful of days drive Bitcoin’s compounded returns
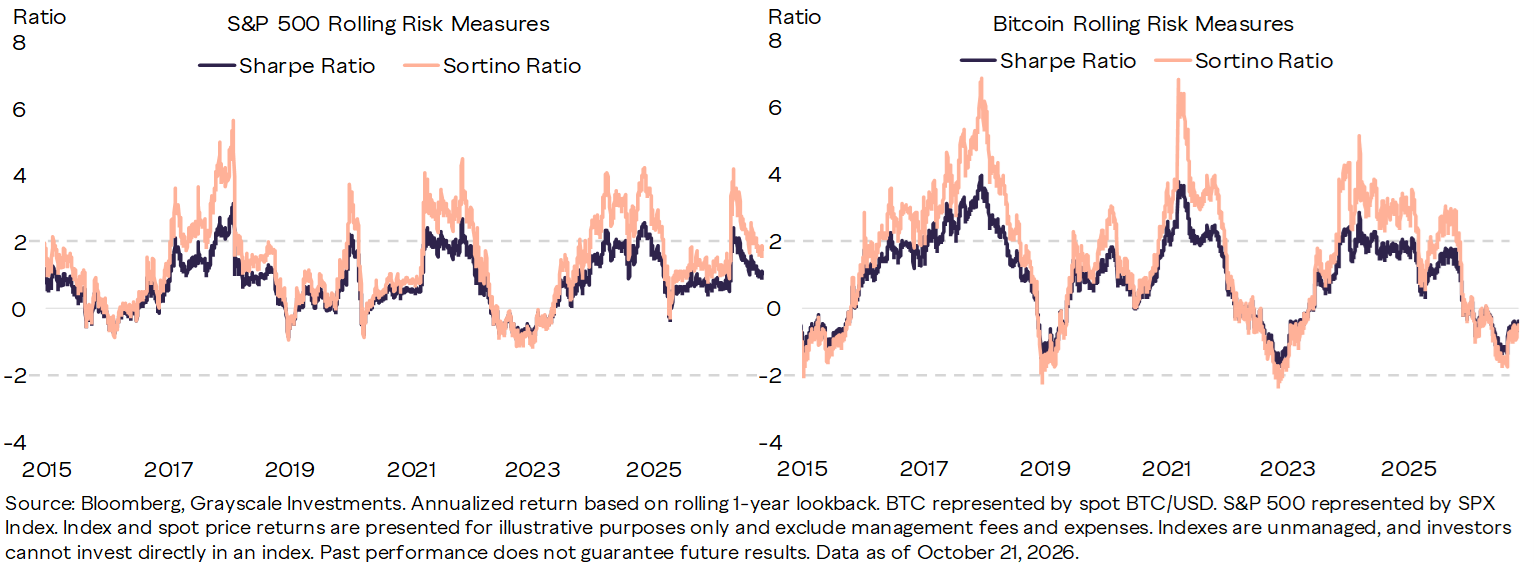
This momentum also affects how Bitcoin’s risk-adjusted performance is measured. Standard deviation, and therefore the Sharpe ratio[3], treats large gains and losses alike. The Sortino ratio,[4] on the other hand, measures returns relative only to downside deviation. During periods of strong positive momentum, Bitcoin’s returns can accelerate faster than its downside deviation, causing the Sortino ratio to spike well above the Sharpe ratio (Exhibit 5). This does not diminish the risk of sharp reversals, but it shows why total volatility provides an incomplete measure of an asset with substantial upside dispersion.
Exhibit 5: Bitcoin’s Sortino ratio highlights its upside-driven volatility
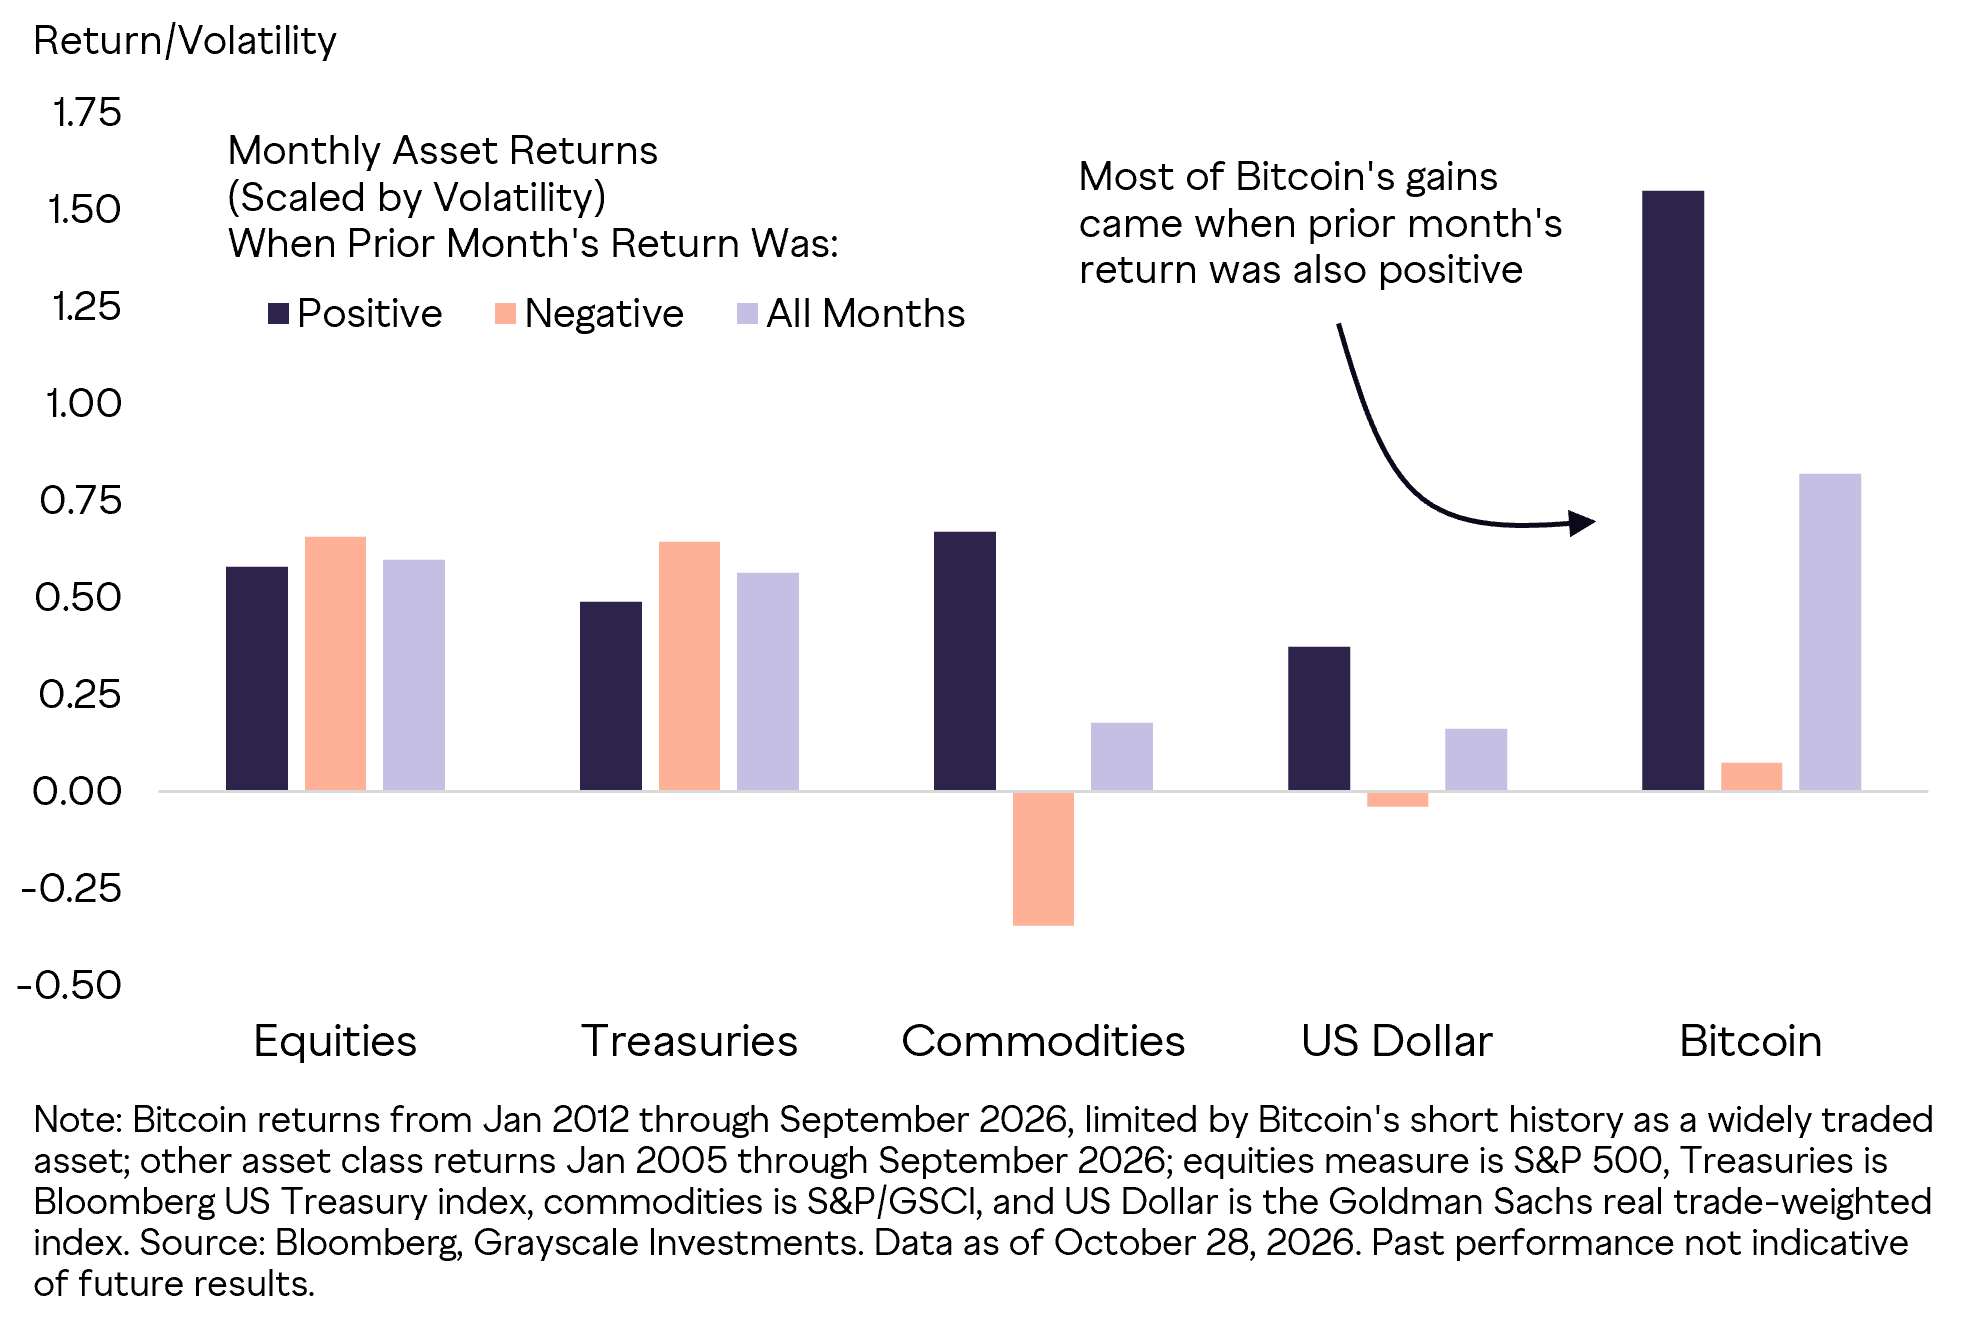
Bitcoin’s momentum is also visible in the sequencing of returns. Volatility-scaled returns have historically been substantially stronger following a positive month than following a negative one, a pattern that is far more pronounced for Bitcoin than for traditional assets. In other words, Bitcoin’s gains have tended to build on themselves. While this pattern is not a standalone trading signal, it helps explain why positive cycles can produce persistent advances, and why the Sortino ratio can rise sharply when upside momentum accelerates without a comparable increase in downside deviation.
Exhibit 6: Bitcoin’s gains have historically built on positive momentum
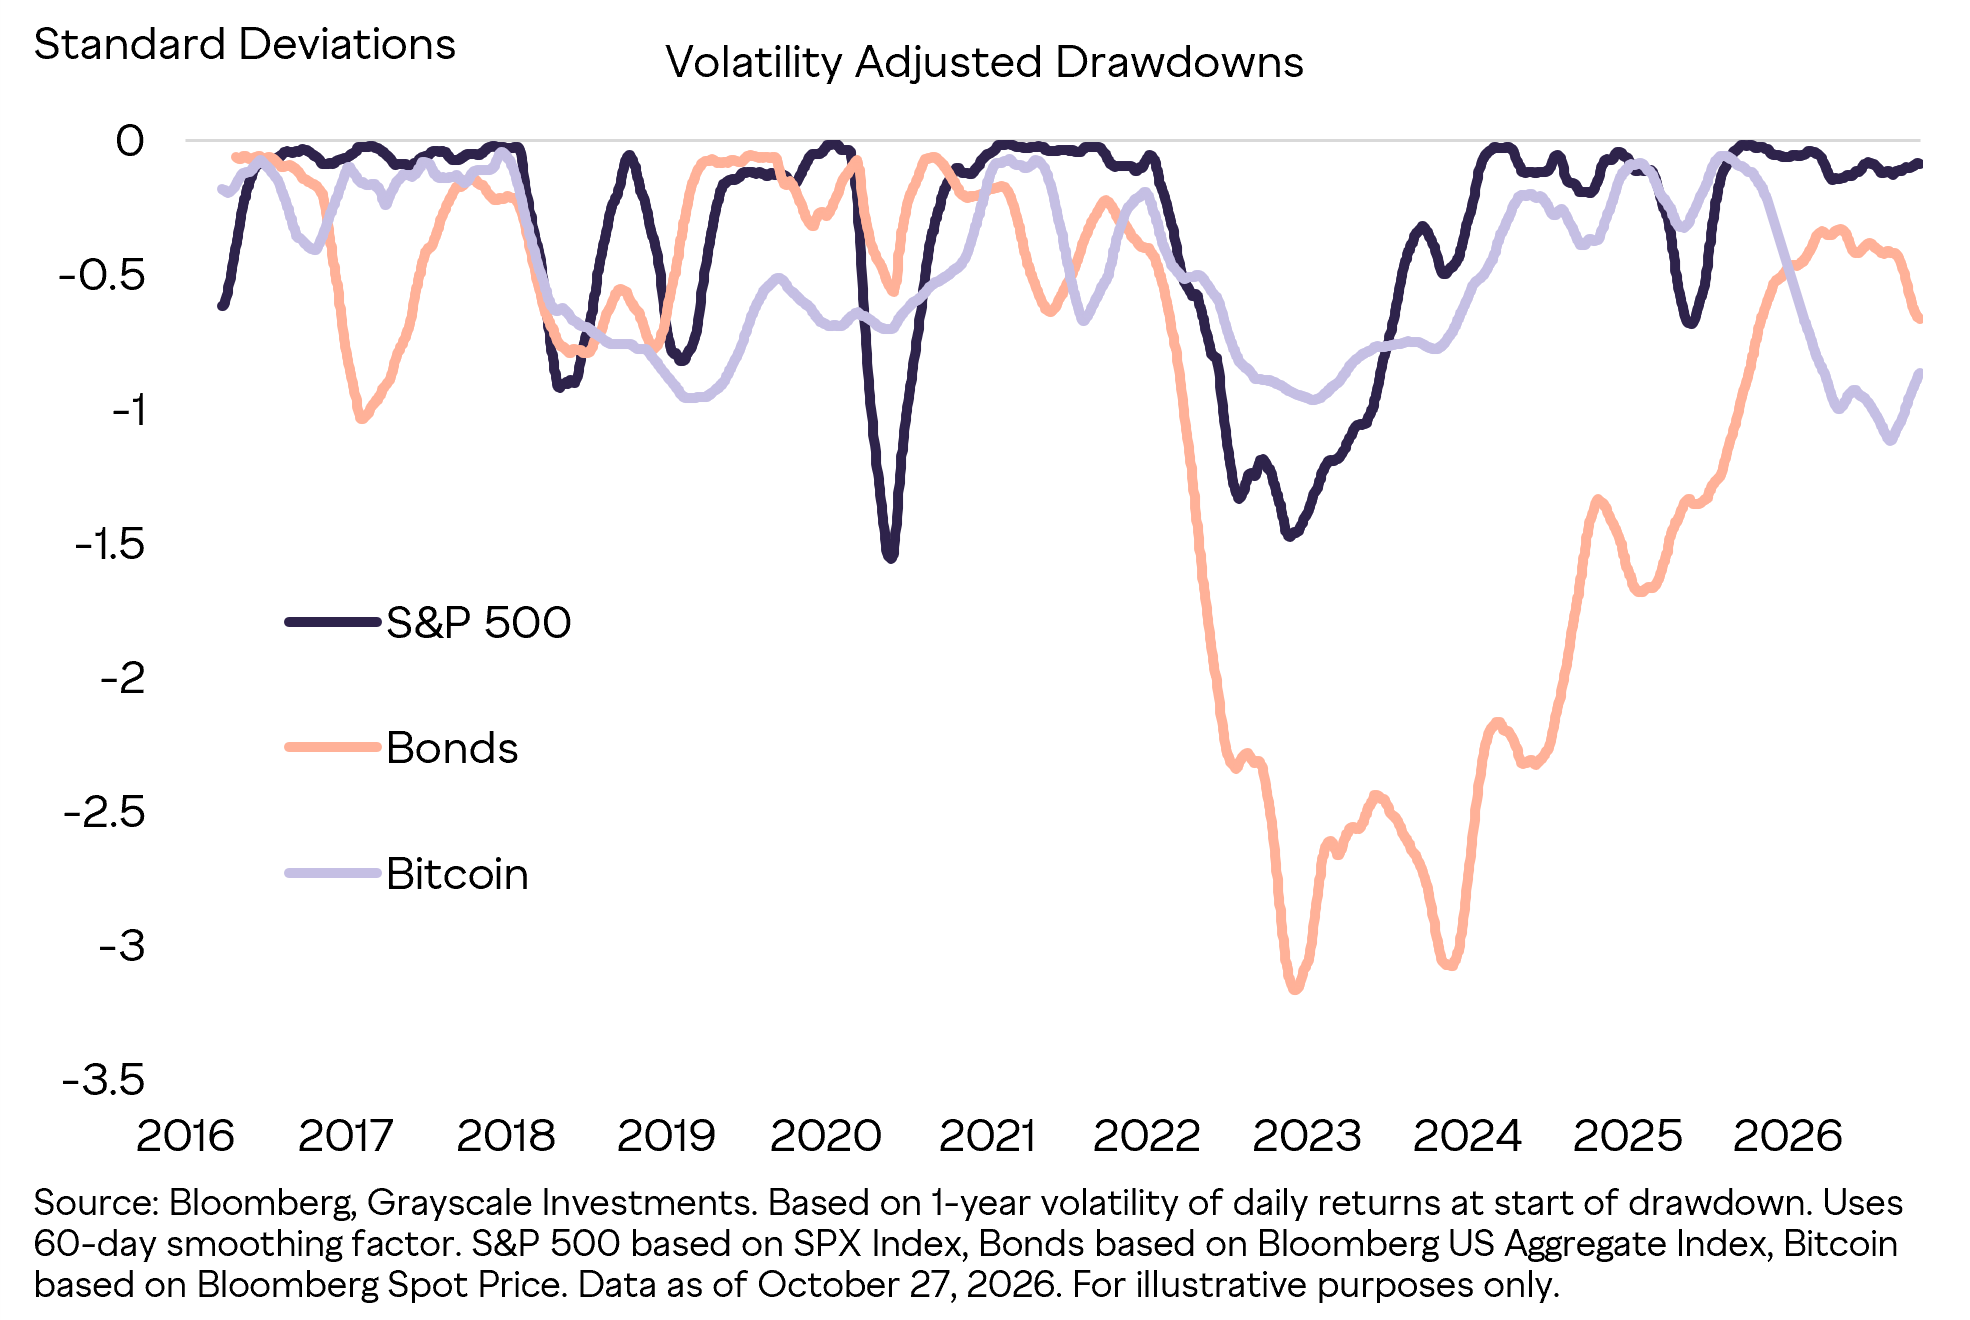
All that being said, Bitcoin’s strong momentum can also produce painful reversals. Sustained advances can unwind quickly, creating drawdowns that appear extreme in percentage terms. Bitcoin’s significant drawdowns are well known: the asset has experienced seven drawdowns of 50% or more since 2011.[5]
But raw drawdowns are difficult to compare across assets with very different levels of volatility. When each decline is scaled by the volatility prevailing at its start, Bitcoin’s drawdowns become less unusual and more comparable with those experienced by equities and bonds—and what really stands out is the large and sustained drawdown for “low risk” bonds in recent years.
Exhibit 7: Bitcoin drawdowns look less extreme after adjusting for volatility
Taken together, these results describe an asset whose returns are wider, more concentrated, and more momentum-driven than a single volatility estimate can reveal. The takeaway is not that Bitcoin’s downside should be discounted, but that its drawdowns are inseparable from the upside dispersion that has historically driven much of its performance. For portfolio managers, treating all volatility as equally undesirable can therefore obscure an important part of Bitcoin’s return profile. The next question is whether this distinctive return pattern compounds the risks investors already hold or introduces a differentiated source of return.
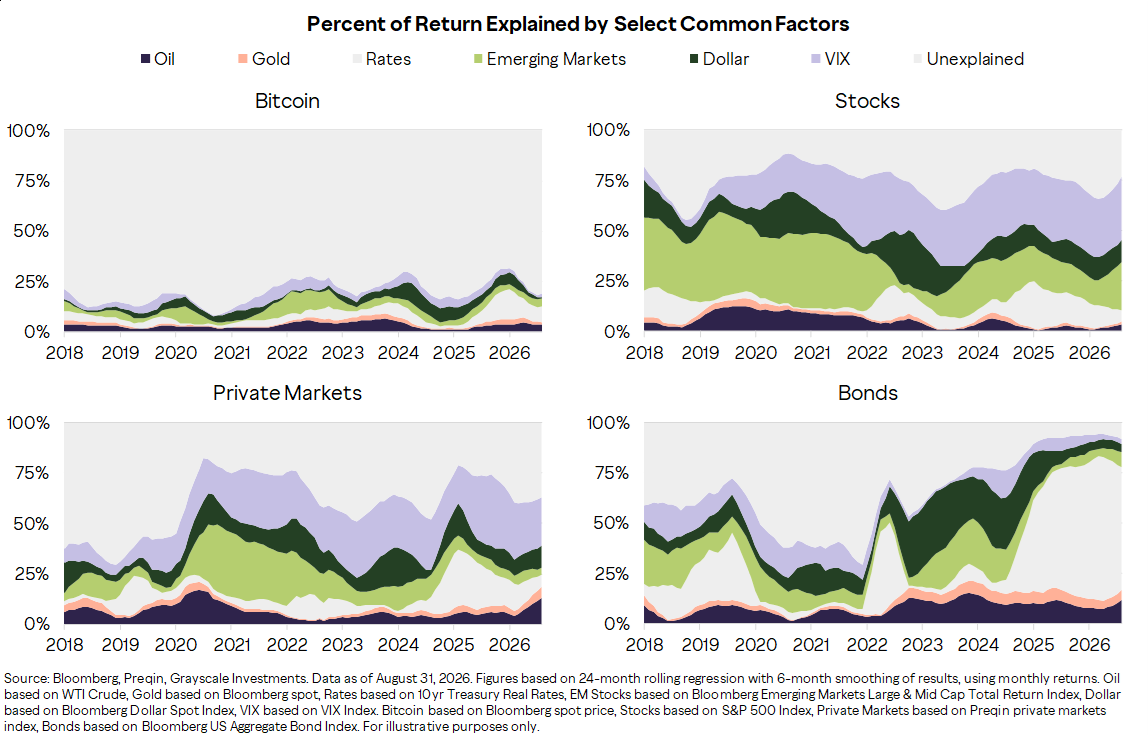
The starting point for that question is how much of Bitcoin’s return behavior overlaps with the factors investors are already exposed to elsewhere. To test that overlap, we regress Bitcoin, stock, bond, and private market returns against a common set of macro and market variables (Exhibit 8). Those factors explain a relatively large share of variation in traditional asset returns, but substantially less of Bitcoin’s. A low explained share does not guarantee diversification, but it suggests that Bitcoin has not historically behaved like a simple repackaging of conventional market exposures.
Exhibit 8: Traditional market factors explain less of Bitcoin’s returns
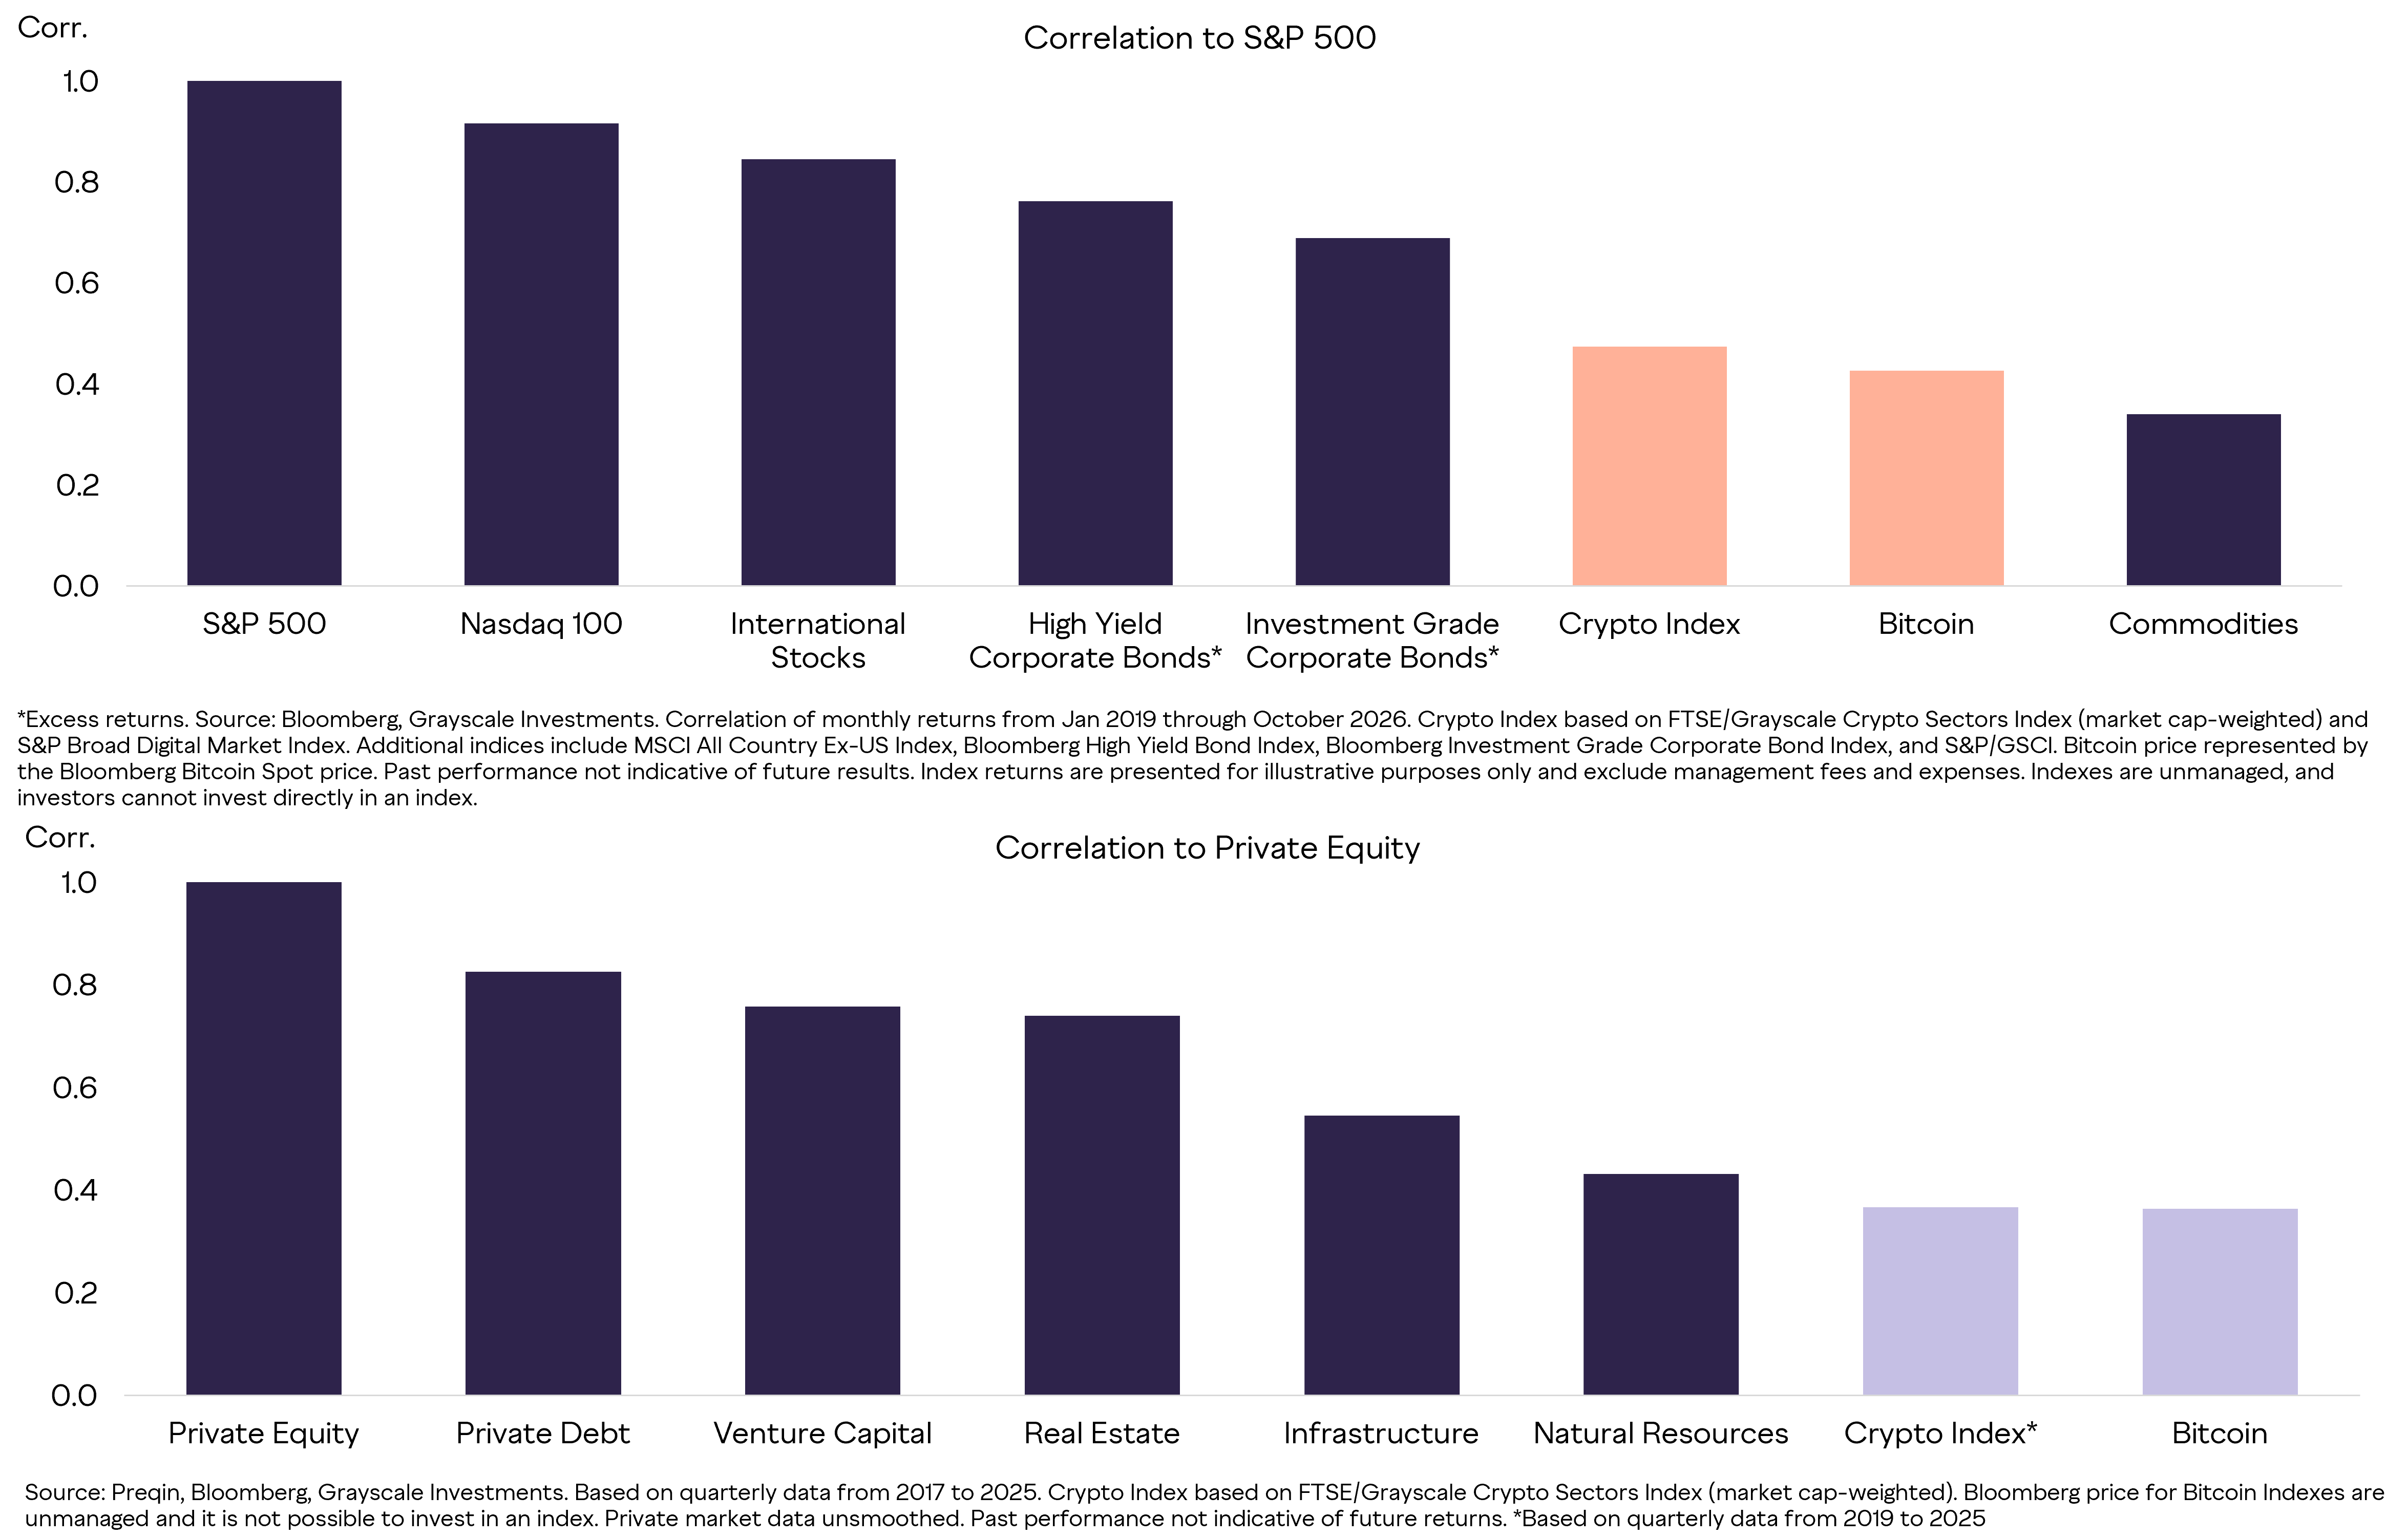
That same distinctness shows up when Bitcoin is compared directly against the public and private assets that make up most institutional portfolios. Bitcoin and the broader crypto market have historically exhibited lower correlations with major public- and private-market benchmarks than those benchmarks have with one another. Correlations are not static and may rise during periods of market stress, but the longer-term pattern indicates that crypto has introduced a differentiated source of return than could be accomplished by simply adding more equity, credit, or illiquidity exposure.
Exhibit 9: Crypto is less correlated with traditional assets than they are with one another
Of course, statistical differentiation matters only if it improves portfolio outcomes. Bitcoin’s lower overlap with traditional assets creates the potential for diversification, but position size determines whether that benefit outweighs its higher standalone volatility. We therefore evaluate Bitcoin’s portfolio impact using both forward-looking capital market assumptions and historical returns to test whether modest allocations improve the portfolio’s expected risk-return trade-off rather than simply adding another source of risk.
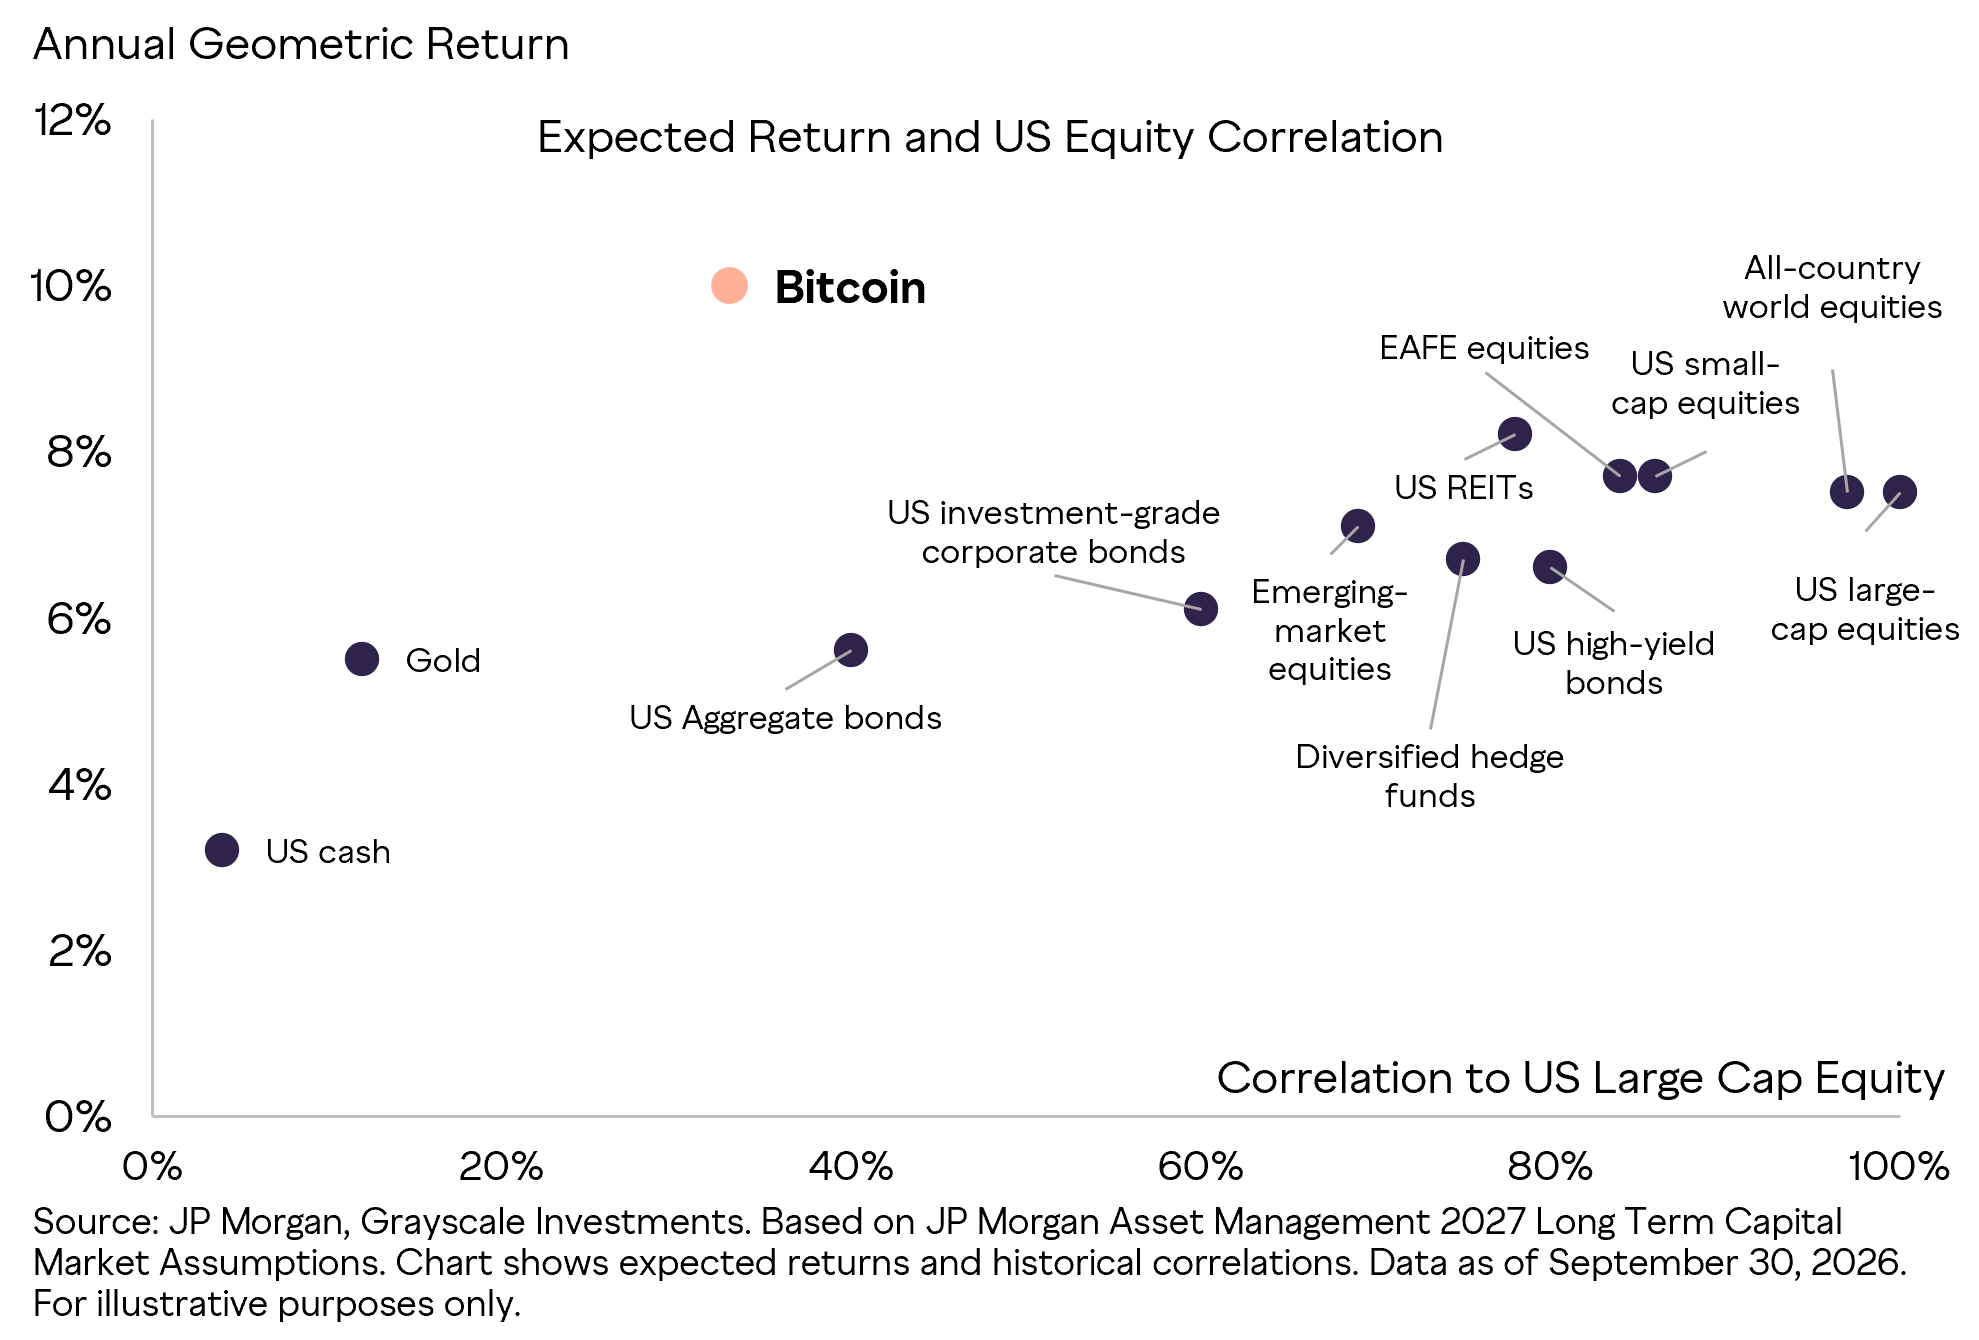
Bitcoin’s inclusion in J.P. Morgan Asset Management’s 2027 Long-Term Capital Market Assumptions marks another milestone in its evolution as an institutional asset. The $5 trillion investment manager now examines Bitcoin alongside established asset classes, forecasting a base-case compound annual return of 10% over the next decade alongside annualized volatility of 55%. These estimates bring Bitcoin’s potential rewards—and higher risks—into a familiar portfolio construction framework. Its projected 10% compound annual return exceeds estimated returns for all other asset classes, while its estimated correlation with US large cap stocks is just 33%—below international equities, corporate bonds, and hedge funds. Assets with high absolute returns and a low correlation to core equities are hard to find, and these features make Bitcoin a potentially attractive portfolio diversifier (Exhibit 10).
Exhibit 10: Capital market assumptions set Bitcoin apart in return and correlation
The forward-looking exercise depends on modeled assumptions; the historical analysis observes what investors have actually experienced. In the sample shown, adding modest Bitcoin allocations to a representative institutional portfolio increased annualized return and the Sharpe ratio, while only modestly affecting volatility and maximum drawdown. These results are consistent with the factor and correlation analysis, but they also reflect Bitcoin’s strong realized performance over the period and should not be solely treated as a forecast for portfolio construction.
Exhibit 11: Modest Bitcoin allocations improved historical portfolio performance
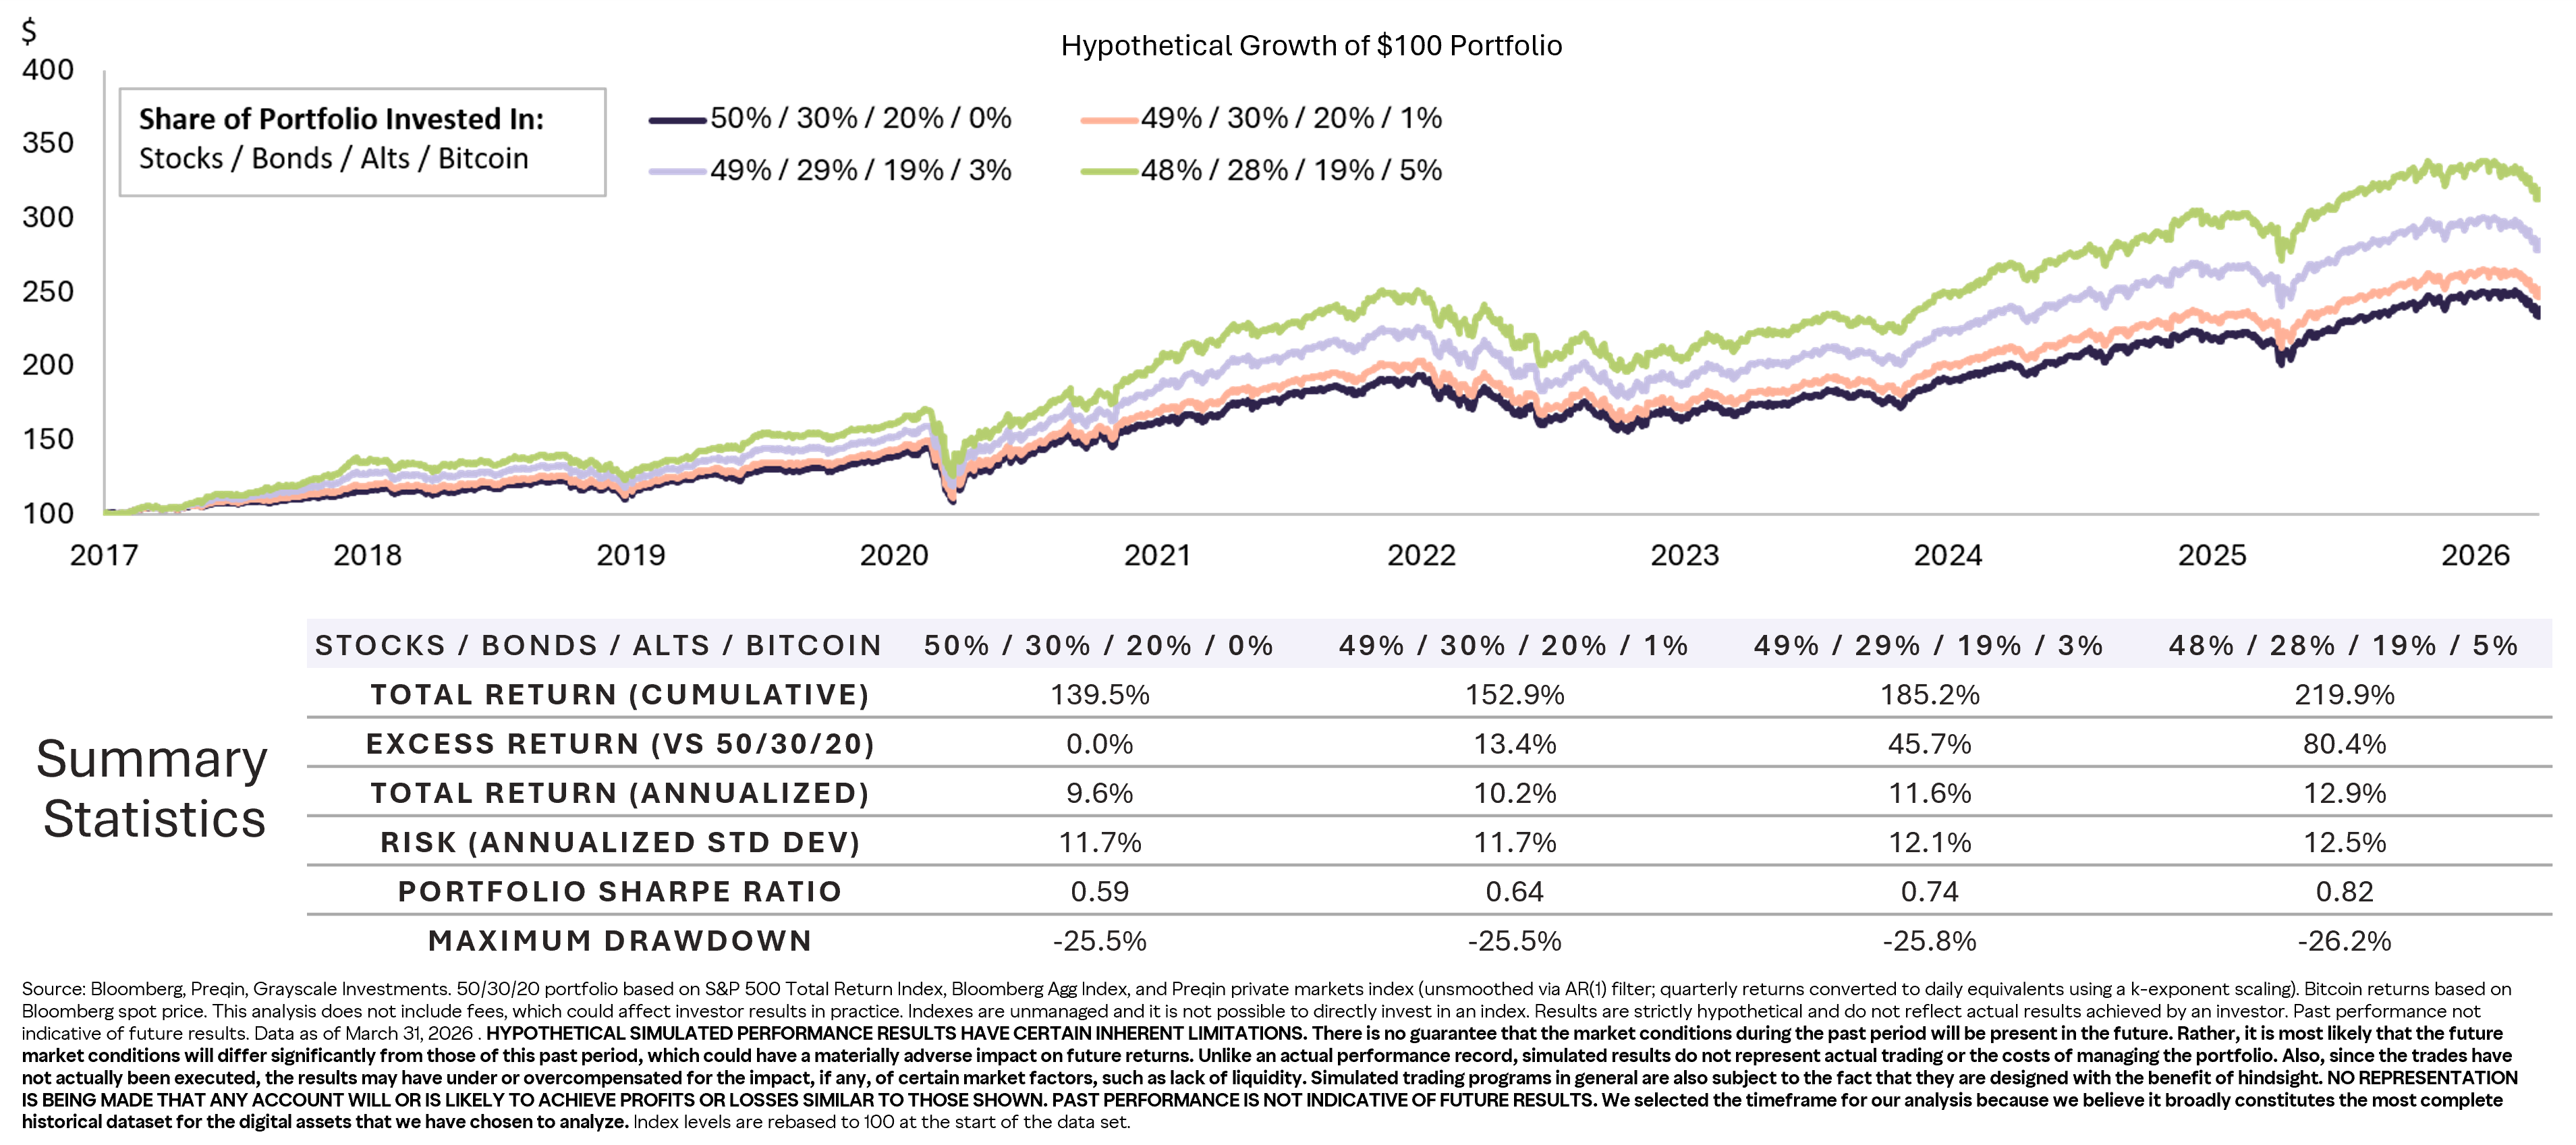
These results reinforce an important distinction: Bitcoin’s standalone volatility does not necessarily translate proportionately into portfolio risk. Its differentiated return drivers have allowed modest allocations to improve historical portfolio efficiency with limited effects on overall volatility and drawdowns. For allocators, the more useful question is not whether Bitcoin is volatile in isolation, but how that volatility affects the broader portfolio. Another important point: Bitcoin is only one part of an increasingly diverse crypto opportunity set.
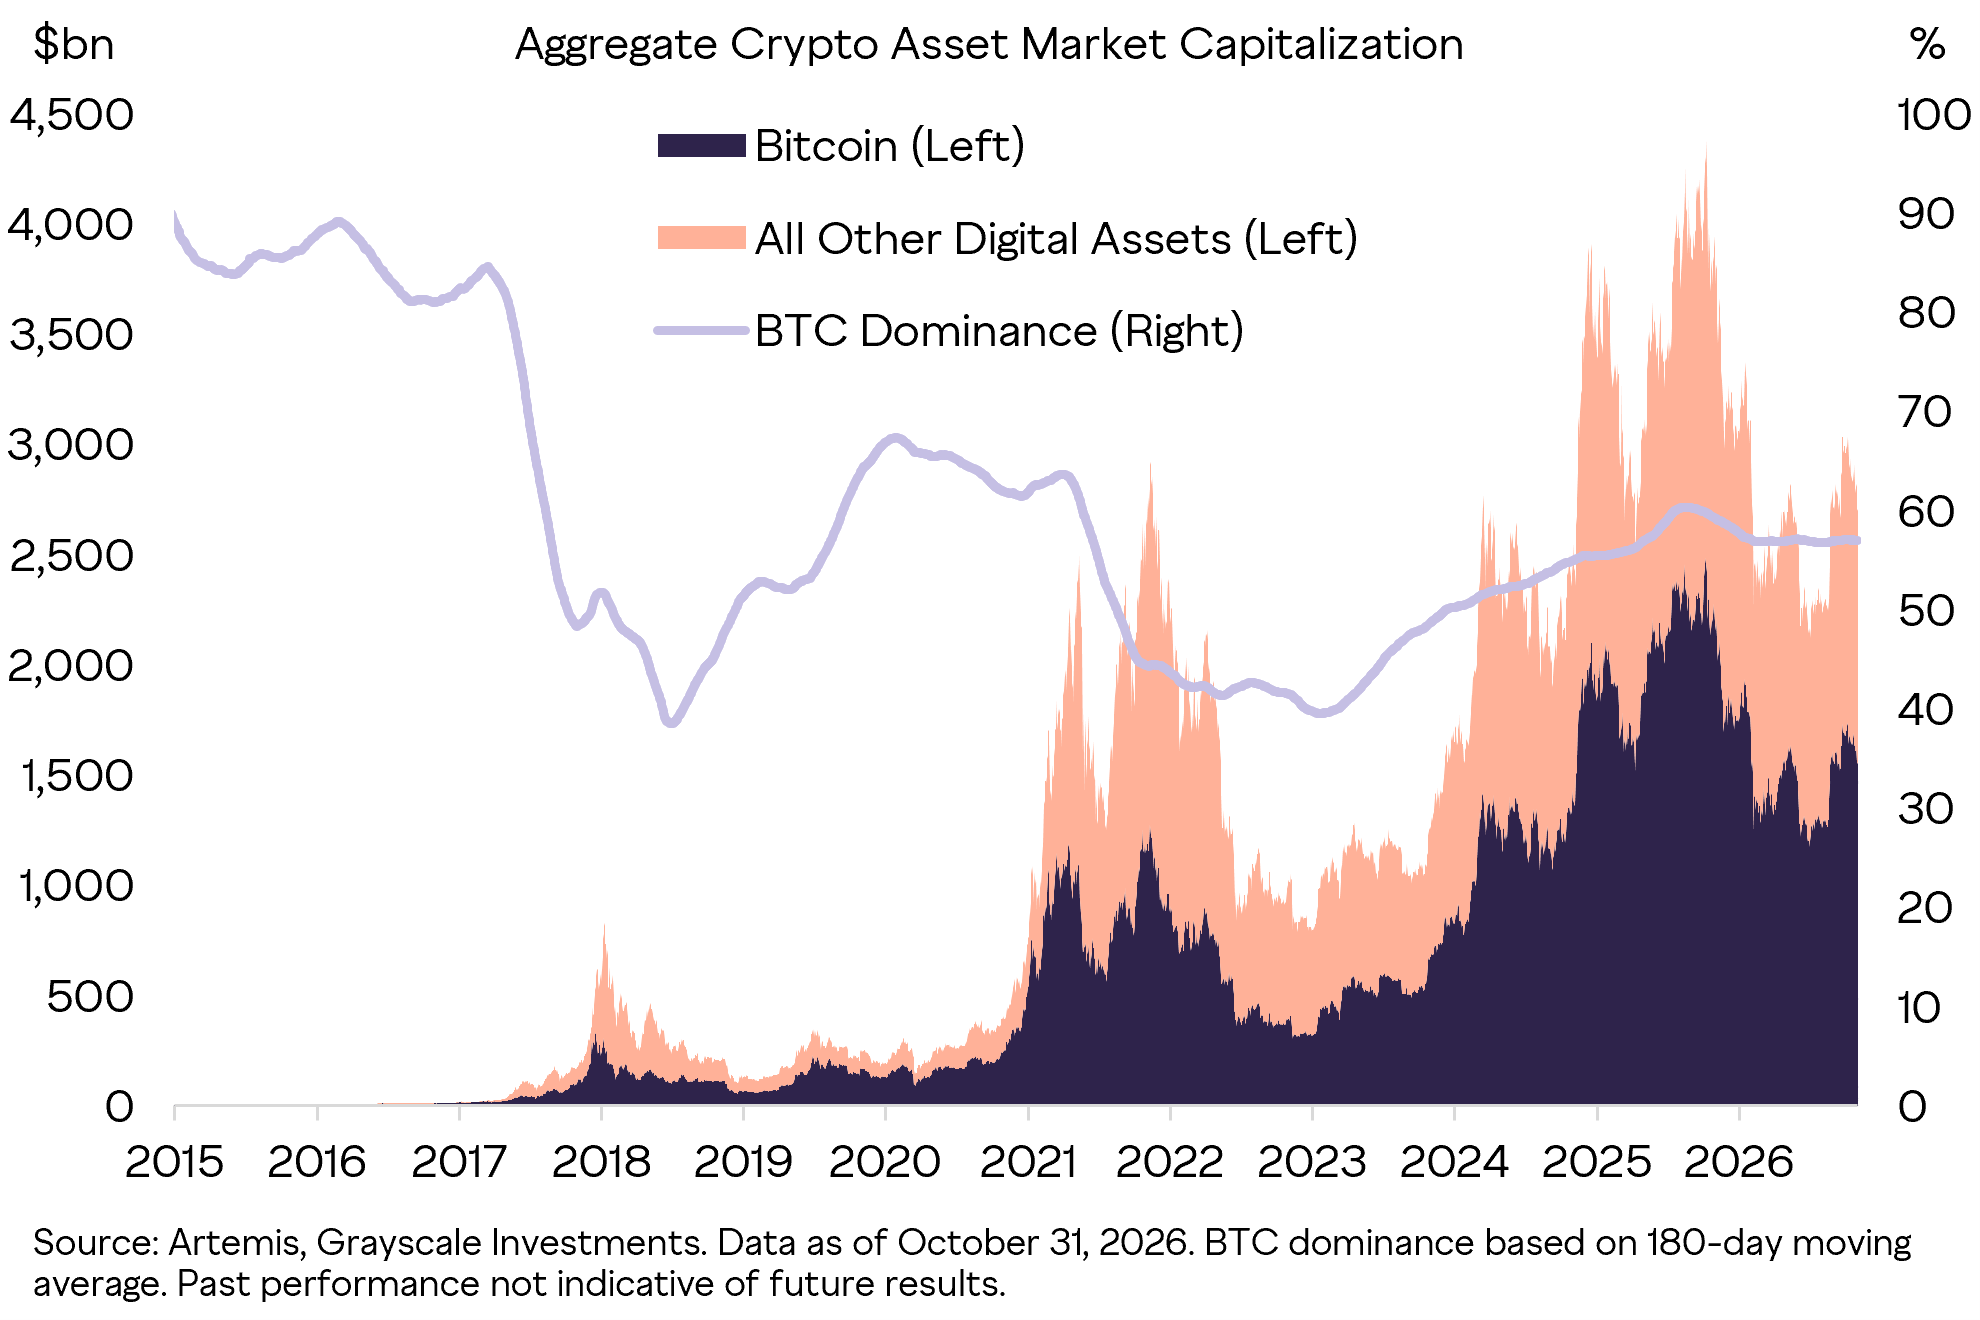
Bitcoin accounts for a majority of crypto’s total market value and, for many institutional portfolios, represents the entire allocation. But the asset class has expanded well beyond a single digital commodity (Exhibit 12). The investable universe now includes smart-contract platforms, decentralized finance, consumer applications, artificial intelligence, and other segments, each with distinct economics, users, and sources of demand. The question for allocators is whether those fundamental differences translate into return patterns distinct enough from Bitcoin to justify holding additional digital assets alongside Bitcoin.
Exhibit 12: Bitcoin dominates market cap, but not the entire crypto opportunity set
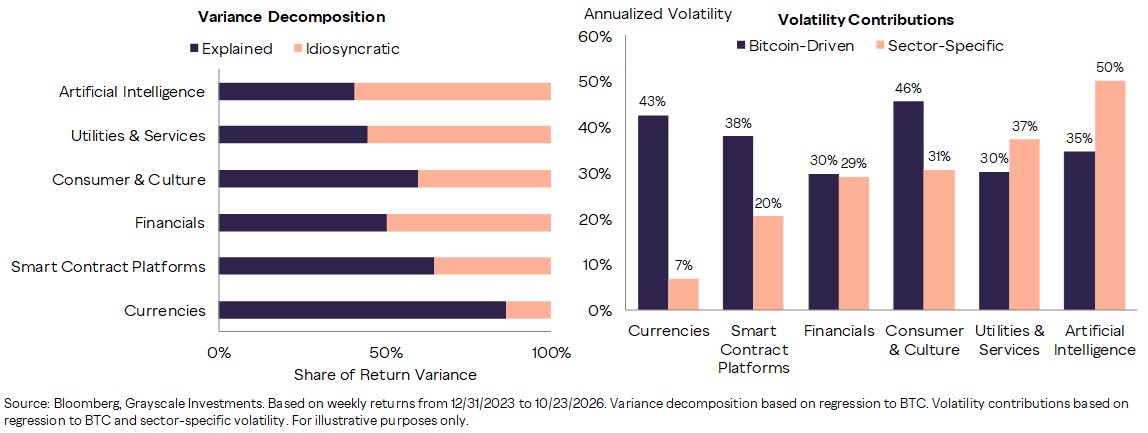
Market share describes the size of the universe, not the behavior of its components. A more useful test is how much of sector returns can be attributed to Bitcoin. If Bitcoin accounts for nearly all variation, the case for diversifying within crypto is weak. If a meaningful share remains sector-specific, the opportunity set is broader than a single Bitcoin beta. Over the past three years, Bitcoin explains only about half of the variation across the FTSE Grayscale Crypto Sectors shown below, leaving a meaningful share of returns attributable to sector- and asset-specific drivers.
Exhibit 13: Bitcoin explains only about half of crypto sector return variation
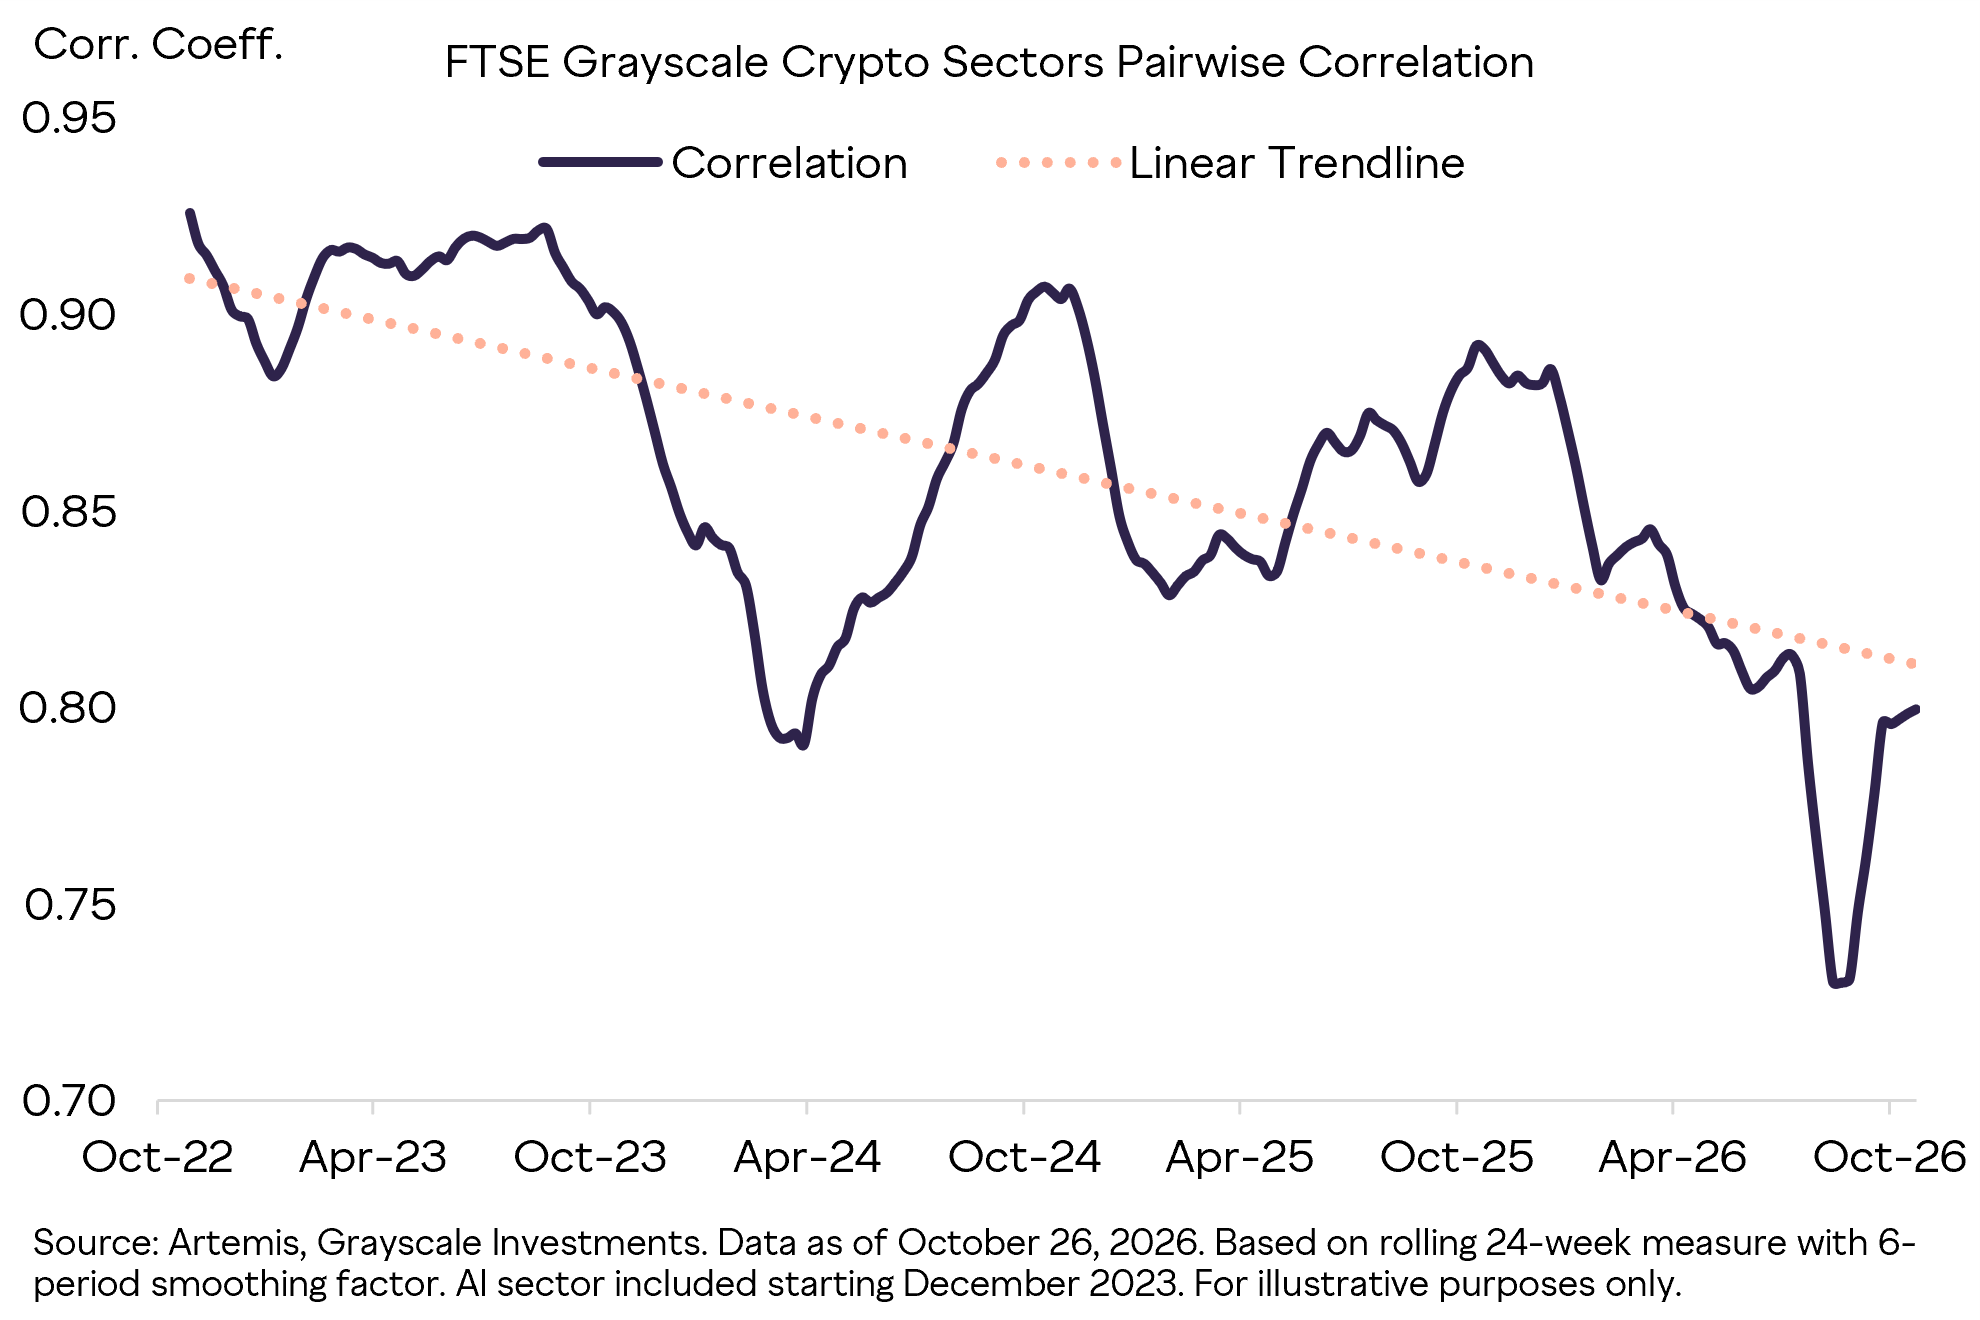
Bitcoin’s explanatory power is only one part of the diversification question. Allocators must also consider how crypto sectors behave relative to one another. Pairwise correlations have declined from earlier peaks as new use cases, business models, and sources of demand have developed across the asset class (Exhibit 14). This decline suggests that crypto’s maturation is producing increasingly differentiated exposures rather than multiple versions of the same Bitcoin-beta trade.
Exhibit 14: Correlations across crypto sectors have declined over time
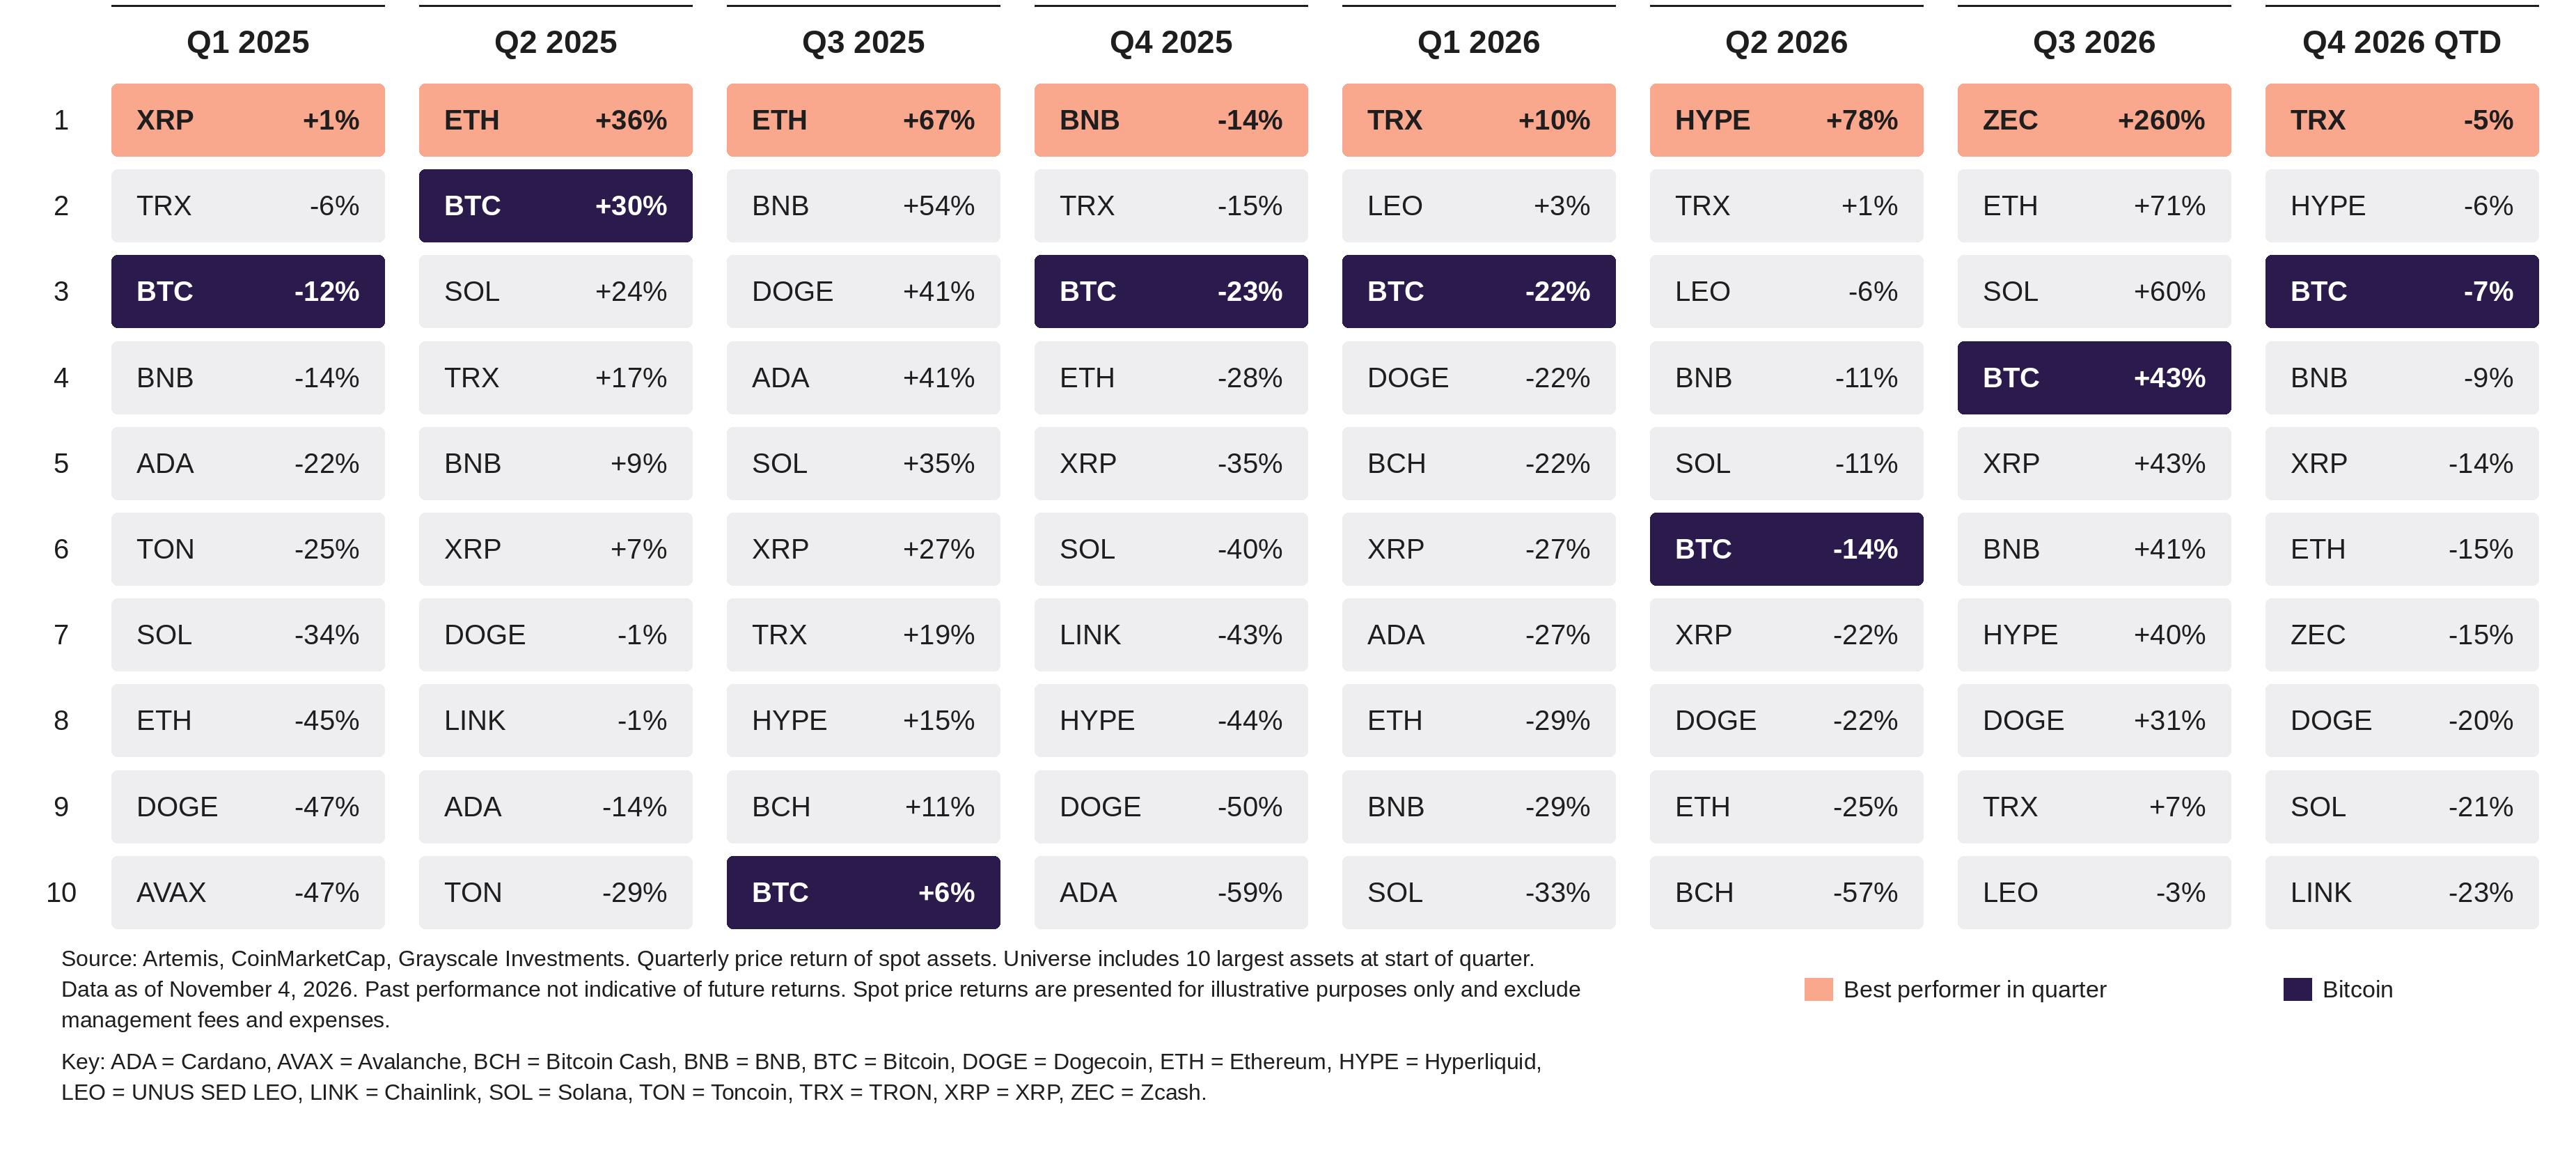
That differentiation is also visible in quarterly performance. Crypto leadership rotates sharply across quarters, and Bitcoin is not always the strongest performer. Different assets led each period shown, while Bitcoin moved largely between the middle and lower portions of the rankings. This dispersion suggests that crypto is not simply a single Bitcoin-beta trade. Among the 10 largest non-stablecoin crypto assets, six different assets led quarterly performance over the past two years; Bitcoin did not lead in any quarter (Exhibit 15).[6] For investors able to identify high-quality projects with differentiated fundamentals, diversification beyond Bitcoin may create opportunities to capture asset-specific alpha across market cycles.
Exhibit 15: Performance leadership has rotated across crypto assets
These results suggest that the broader crypto market is increasingly behaving like a collection of distinct exposures rather than a single trade. Bitcoin may remain the foundation of many allocations, but declining sector correlations and rotating leadership suggest that diversification within crypto can provide an additional source of portfolio opportunity. For portfolio managers, building a crypto allocation may therefore involve not only deciding how much Bitcoin to hold, but also which other sources of return deserve a place alongside it.
Crypto risk frameworks should reflect how the asset class has evolved. Bitcoin’s realized volatility has declined materially and now sits within the range of individual large-cap US stocks. Its strong momentum also makes the sequence of returns especially important, with sustained gains and sharp reversals producing a return experience that headline volatility alone cannot capture. Its returns remain differentiated from many traditional market exposures, allowing modest allocations to help improve portfolio efficiency in the analyses shown here. Beyond Bitcoin, declining sector correlations and rotating leadership suggest that crypto is developing into a broader set of distinct investment exposures.
None of this means crypto is low risk. It means that risk should be evaluated across more than one dimension: how much an asset moves, how those returns are distributed and sequenced, how they interact with the rest of a portfolio, and how exposures differ within the asset class itself.
Exhibit 16: A Portfolio Framework for Crypto Risk
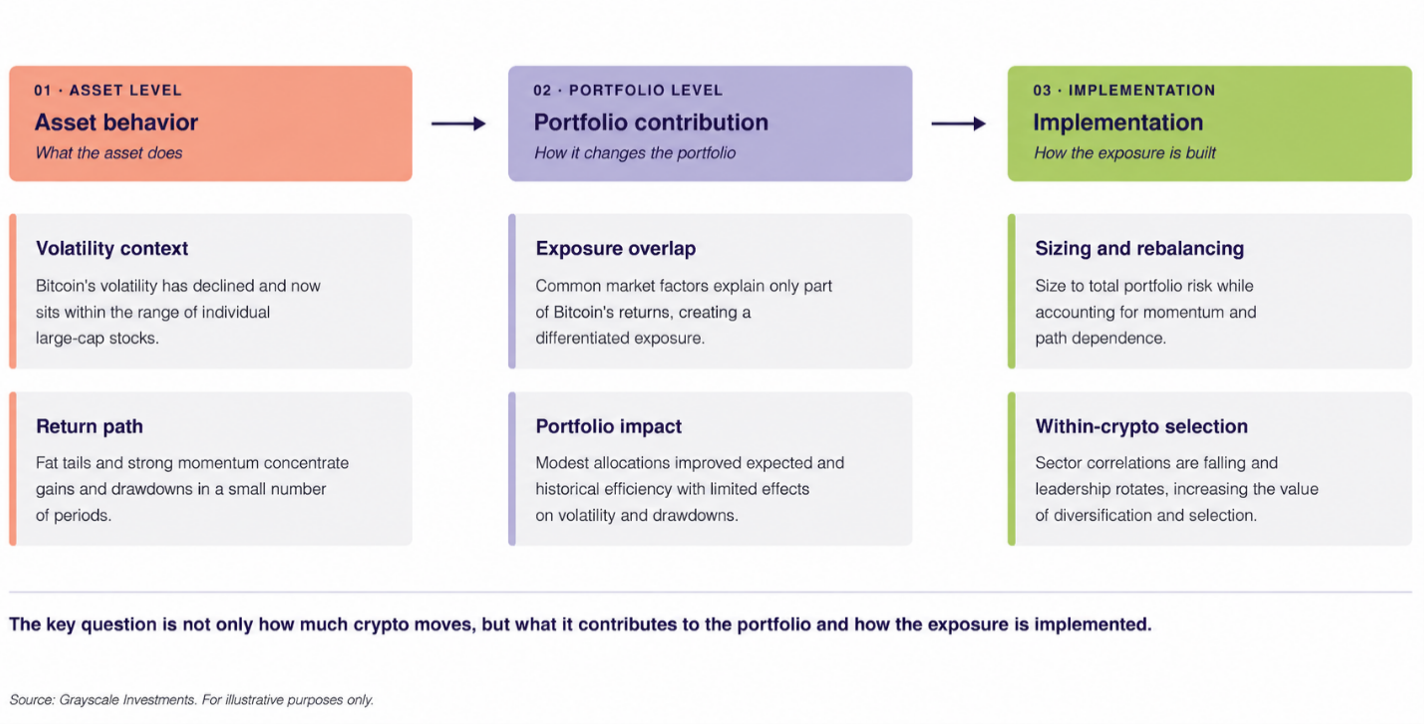
For portfolio managers, the practical implication is not to look past volatility, but to place it in the proper context. A framework focused only on how much crypto moves can miss where that volatility comes from and what it contributes to the broader portfolio. The more useful questions are what risks crypto adds, which existing risks it may diversify, and where differentiated sources of return are emerging within the asset class.
[1] Coin Metrics. Based on 15 year lookback period and 52 week rolling volatility. Data as of October 31, 2026.
[2] Bloomberg. Data as of October 6, 2026.
[3] Sharpe Ratio = (Portfolio Return – Risk-free-rate) / Total Standard Deviation
The Sharpe ratio measures an investment’s return above a risk-free rate relative to its volatility, with a higher ratio generally indicating better risk-adjusted performance.
[4] Sortino Ratio = (Portfolio Return – Risk-free-rate) / Downside Deviation
The Sortino ratio measures an investment’s return relative to its downside risk, focusing on negative returns rather than overall volatility.
[5] Coin Metrics. Data as of November 3, 2026.
[6] Artemis, CoinMarketCap. Excludes stablecoins. Data as of November 4, 2026.